Download
1 / 35
3.1k likes | 7.24k Views
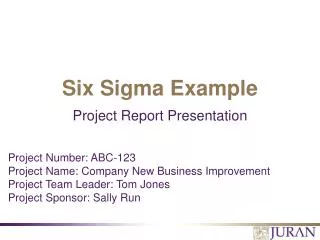
SIX SIGMA DMAIC Example. Six Sigma Road Map. SIX SIGMA DEFINE PHASE. Problem Statement:. Goal:. Business Case:. Scope:. Cost Benefit Projection:. Milestones:. VOC. Key Issue. CTQ. Complete high-level “as is”. process map and analyze. yield to identify the process.

E N D
SIX SIGMA DEFINE PHASE
Problem Statement: Goal: Business Case: Scope: Cost Benefit Projection: Milestones: VOC Key Issue CTQ Complete high-level “as is” process map and analyze yield to identify the process step with the highest impact Define Business Case Business Case Explain why it is important to work Project Charter on this project Develop charter to include project description, baseline measures, business results, team members, and schedule. Use Benchmarking as appropriate to establish some of the initial targets. VOC Gather / display data verifying customer needs C S SIPOC U U and requirements S P T P O L Outputs Inputs Process M I Delighters E E Yield: 60% R R S S Yield: 90% More Is Better Yield: 45% Yield: 98% Must Be
Define • The Charter • The business case • The problem statement • Project scope • Goals and Objectives • Milestones • Roles and responsibilities of the project team • Master Black Belt • Black Belt • Green Belt
Define • The business case • Food ordering delivery has experienced such variation that spoilage and inventory has increased. • These negative effects of food delivery variation are negatively impacting revenue and profit margin.
Define • The problem statement • Since June 14, 1999 Fast Food Is Us has experienced an average delivery time of 4:00 p.m. (versus the target of 2:00 p.m.) which has resulted in food spoilage, excessive inventory, and the inability for the food preparation people to properly budget staff for pick loads.
Define • Project scope • IN • All domestic stores • Food suppliers • OUT • Foreign stores • Trucking firms
Define • Goals and Objectives • Reduce problems by 50% • Milestones • Define by Nov. 2002 • Measure by Nov. 2002 • Analyze by Jan. 2003 • Improve by Apr. 2003 • Control by May. 2003
Define • Team (Roles and responsibilities of the project team) • Champion : Paula Pangborn • Team Leader: Jim Washington • Master Black Belt: Frank O’Shaunessy • Team Members: (Roles & Percent of Time) • Anita Snite • Robyn Haggar • Jonas Brennan • Brenda Faust • Dustin Theisman • Fiona Reckers
Elements of a Charter Project # : PROJ/VP/1.0 Project Importance Project Name : Project Start Date : Targeted Project End Date : Process Problem Team Sponsor: Project Lead: Quality Manager/Coach: Subject Matter Experts: Project Team: Project Goals/Impact/Expected Benefits Risks/Dependencies Process Start/Stop Start Point: Stop Point: Process Measurements Characteristic : Measure : Defect Definition : Project Milestones ANALYSE CONTROL DEFINE IMPROVE MEASURE Milestone: Date:
Define • Customers, Their Needs and Requirements • Delivery time • Food quantity accuracy • Food quantity freshness
List customers Define customer segments Narrow list Organize all customer data Translate VOC to specific needs Define CTQs forspecific needs Prioritize CTQs Contain problem if necessary Steps to Determine CTQs A Process To Identify Customers And Understand Their CTQs Voice Of The Customer (VOC) Determine CTQs Identify Customers • Review existing VOC data • Decide what to collect/ select VOC tools • Collect data
Gather VOC Data : Review Existing VOC Data Project Team 1 Project Team 2 Project Team 3 • Avoid duplication of effort for both you and the customer Surveys Personal Visits Questionnaires Interviews Customer Phone Calls
I want Food Preparation CTQ Tree 2nd Level 1st Level Delivery time Food order delivery Food quantity accuracy Food quantity freshness
Type of room Accuracy Hospital Ward I want Timeliness Registration Courtesy Health Care Provider CTQ Tree 1st Level 2nd Level Need General (need) Behavioral (requirement)
VOC Example VOC CTQ Defect Definition Measure “Your cars take too damn long to start.” “Do you have more than one person answering the phones there?” Engine starts fast Call answered promptly Engine start time is greater than 3 seconds Any call answered after third ring Time from turning of key to sustained idle (in seconds) Time from beginning of first ring to greeting.
Define • The High Level Process Map • Name the process (use nouns) • Establish the start and stop points of the process. • Determine the output(s) of the process (use nouns) • Determine the customer(s) of the process • Determine the supplier(s) of the process • Determine the input(s) of the process • Agree on the five to seven high level steps that occur between the start and stop points of the process (use action words like verbs and adjectives)
The Process Map • Keys to Using Process Map • Don’t rush to the creation of the should be map, this occurs in the Improve stage of DMAIC. • Capture all of the steps as they actually occur in the process, not the way you would like to see the steps in the process • Use verbs or adjectives to describe steps in the process • Use unqualified nouns to describe the output and inputs of the process
The Process Map • Keys to Using Process Map • To verify any map, do two things. Talk to the people in the process and follow the product or service through the process. In the case shown, the project team should follow a lab order from beginning to end. • Make sure to capture both easily seen and invisible steps. Invisible steps are the waits or moves of the product or service being mapped. • Don’t map the best or worst case map, map what is representative of how the process normally works.
Define • The High Level Process Map • Define SIPOC Model: SUPPLIERS PROCESS CUSTOMERS INPUTS OUTPUTS
Define • The High Level Process Map • Process map symbols • Start/stop of a process • Decision point • Step in the process • Direction in the process
Food ordering delivery processhigh level process map Customers Suppliers Inputs Process Outputs Receipt of order requests from restaurant Truck unloaded Food suppliers Food delivery Food prep personnel Food Supplier contacted Order negotiated Orders placed Delivery scheduled Delivery tracked Delivery occurs
Hospital lab test ordering processhigh level process map Hospital lab test ordering process Customers Suppliers Inputs Outputs Doctor receives lab report Doctor orders lab Phlebotomy department Patient Order Lab result Place order Obtain specifications Specifications compared to lab order Test Report
SIX SIGMA MEASURE PHASE
Measures Measures I P O Develop measures based on CTQ’s and SIPOC map Input Process Output Measures Measures Measures Funneling Process Capability O1 O2 O3 O4 LSL USL I1 Cp = 0.4 FMEA I2 s I3 = 2.7 Calculate current process I4 capability and sigma Determine the critical few measures Data Display Data Collection Plan Gage R&R UCL Data Collection Plan Col # 1 2 3 4 5 6 1000 Inspector A B What questions do you want to answer? Sample # 1st Trial 2nd Trial Diff 1st Trial 2nd Trial Diff X Data Operational Definition and Procedures 0 1 2.0 1.0 1.0 1.5 1.5 0.0 2 2.0 3.0 1.0 2.5 2.5 0.0 What Measure type/ How Related Sampling How/ LCL 3 1.5 1.0 0.5 2.0 1.5 0.5 Data type measured conditions notes where -1000 4 3.0 3.0 0.0 2.0 2.5 0.5 5 2.0 1.5 0.5 1.5 0.5 1.0 Totals 10.5 9.5 3.0 9.5 8.5 2.0 10 20 30 Averages 2.1 1.9 0.6 1.9 1.7 0.4 How will you ensure What is your plan for Sum Sum 3.6 4.0 consistency and stability? starting data collection? R R 1.8 A 2.0 B Other D B F A C E A B X X How will the data be displayed? Validate your Develop a data Display the data in graphic measurement system collection plan form to show current variation and other patterns Measure
Measure • Creation of the Data Collection Plan • What to measure • The type of measure • The type of data • Operational definitions • Targets/specifications • Data collection forms • Sampling
Measure • Implementation of the Data Collection Plan • Calculating baseline sigma (defects per million opportunity)
Measure • Calculating baseline sigma (defects per million opportunity) • Food order unit: • A delivery • Food order defects: • Delivery time either too early or late • Food order quantity inaccurate • Food order not fresh • Number of opportunity: • 3 ( one for each of the above ways to generate a defect)
Measure • Calculating baseline sigma (defects per million opportunities) • The food ordering delivery project team examines 50 deliveries and finds out the followings: • Delivery time either too early or late (13) • Food order quantity inaccurate (3) • Food order not fresh (0) • To then calculate the defects per million opportunities we would implement the following equation: • (Number of defects)/(Number of units*Number of opportunities)*1000000 • 16/(50*3)*1000000=0.107*1000000=106667 per million opportunities • Is equivalent to a sigma performance of between 2.7 and 2.8
Process Capability The Concept of Sigma D N•O DPO = 133 1 1. Number of Units processed N = __________ 2. Number of Defect Opportunities Per Unit O = __________ 3. Total number of Defects made (>24 hours) D = __________ (include defects made and later fixed) 4. Solve for Defects Per Opportunity 5. Convert DPO to DPMO 6. Look up Process Sigma in Abridged Process Sigma Conversion Table Sigma(ST) = __________ 18 ( 18 ) ( 133 ) ( 1 ) 0.135300 = = = 0.135300 * 1000,000 = 135,300 2.6