Download
1 / 16
160 likes | 263 Views
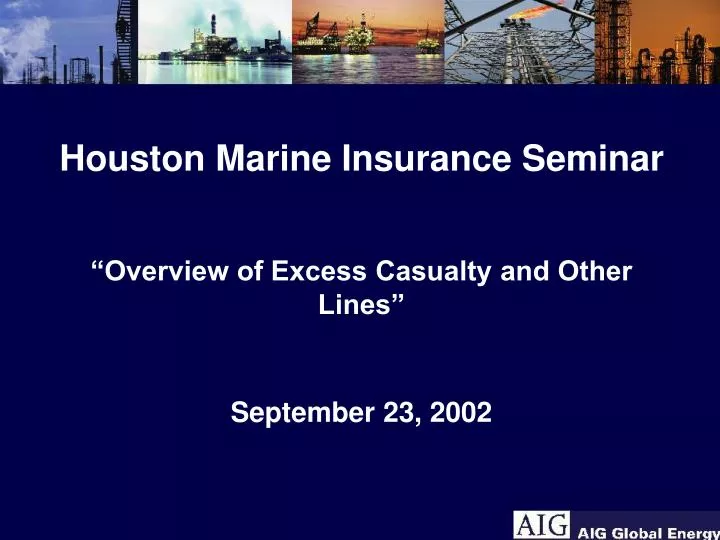
Houston Marine Insurance Seminar “Overview of Excess Casualty and Other Lines” September 23, 2002. U. S. Equity Markets 2001-02. 0. -5. -7.10%. -10. -7.66%. 2001. -13.04%. -15. -13.84%. 6 Mos. 2002. -20. -21.05%. -25. -26.12%. -30. Nasdaq. S&P 500. Dow Jones.

E N D
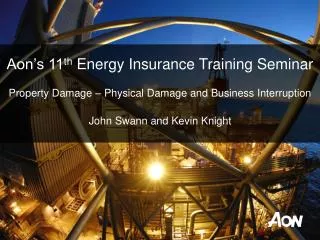
Houston Marine Insurance Seminar • “Overview of Excess Casualty and Other Lines” • September 23, 2002
U. S. Equity Markets 2001-02 0 -5 -7.10% -10 -7.66% 2001 -13.04% -15 -13.84% 6 Mos. 2002 -20 -21.05% -25 -26.12% -30 Nasdaq S&P 500 Dow Jones
P/C Insurer Financial Strength 2001 • 6 companies ratings were raised • 209 companies ratings were lowered • 24 companies became insolvent - all of which were rated below S&P “BBB” • Source: Standards & Poor’s, March 27, 2002
Growth in U.S. P&C NPW ( All Lines) 2000: 5.1%2001 Estimate: 10.3%*2002 Forecast: 15.1%* Source: A.M. Best, Insurance Information Institute*Estimate based on III 2002 Earlybird Survey
Underwriting Gain (Loss) 1975 - 2001 2001* *2001 estimate based on first 9 months including assumptions for WTC losses.Source: A.M. Best, Insurance Information Institute
World’s costliest property catastrophe insurance losses, 1970 to 2001 • Insured Loss • ($millions) Date Event Country • 1 40-60 BN* 11/9/01 Terrorist attack on WTC, Pentagon United States 2 20,185 23/8/92 Hurricane Andrew United States, Bahamas • 3 16,720 17/1/94 Northridge Earthquake United States • 4 7,338 27/9/91 Typhoon Mireille Japan • 5 6,221 25/1/90 Winterstorm Daria France, GB, B • 6 6,164 25/12/99 Winterstorm Lothar France, CH • 7 5,990 15/9/89 Hurricane Hugo Puerto Rico, United States • 8 4,674 15/10/87 Storms and floods Europe • 9 4,323 25/2/90 Winterstorm Vivian Western/Central Europe • 10 4,293 22/9/99 Typhoon Bart Japan • 11 3,833 20/9/98 Hurricane Georges United States, Caribbean • 12 3,150 5/6/01 Tropical Storm Allison United States • 13 2,994 6/7/88 Piper Alpha oil platform explosion Great Britain • 14 2,872 17/1/95 Great Hanshin earthquake, Kobe Japan • 15 2,551 27/12/99 Winterstorm Martin France, Spain, CH • 16 2,508 10/9/99 Hurricane Floyd, flooding United States • 17 2,440 1/10/95 Hurricane Opal United States, Mexico • 18 2,144 10/3/93 Blizzard, tornadoes United States • 19 2,019 11/9/92 Hurricane Iniki United States • 20 @2,000 Aug ‘02 European Floods • Source: Swiss Re, Sigma. At 2001 prices • WTC property losses alone estimated at $19BN.
$1.35BN $1.4BN $1.2BN $950M $1BN $800M $600M $440M $300M $400M $110M $200M $0 '98 '99 '00 '01 '02* Energy Property Losses * 02 Loss Exceeding $50M include: Gas, plant fire, Kuwait $150M Refinery fire, Japan $ 75M Power station flood, Washington State $ 70M
70 60 50 40 1994- 1996 30 1999- 20 2000 10 0 Products Business Medical Premises Vehicular Liability Negligence Malpractice Liability Liability* Percent of Awards Greater Than $1 Million By Liability Type * Includes Personal Auto Source: Current Award Trends in Personal Injury 2001 Jury Verdict Research
Impact of Loss Cost Trends on Excess Casualty • Attachment points have not kept pace with loss cost trends • Frequency - More claims now penetrating excess layer • Severity • More severity losses • Excess layer receives the bulk of severity increases • Higher attachment points would offset, in part, the effect of new losses trending into the excess layer
Workers Compensation Post 9/11/01 • “Employee concentration” issues long existed, but 9/11 made the potential real with catastrophic results. • 9/11 brought new analytic, catastrophic modeling into common use: • Aggregation analysis: identifying substantial numbers of employees at a single location or in a single area • Geo-coding: quantifying high-risk geographic zones exposures across multiple lines of insurance • Heightened emphasis on material risk information, including review of insured’s disaster and business continuity plans.
Vehicular Liability Jury Awards(including Personal Auto) • %Change • 1994 2000 2005? 1994-2000 • Top Award $20,625,000 $46,000,000 ? 123% • Mean Award $187,152 $268,648 ? 44% • Underwriters are pricing risks today for possible events which will not be adjudicated until 2005. • The U.S. Department of Transportation estimates the average costs of an auto fatality in the year 2000 was $977,000. The average cost of a critical injury was $1,100,000. • U.S. Department of Transportation, National Highway Traffic Safety Administration (NHTSA), May 2002.
Asbestos, MTBE & Mold • Asbestos • Unparalleled loss estimates • 300,000 court cases in U.S, and rising • Unveiling of “unimpaired cases” premise • MTBE • Energy insurance sector liability concerns • Mold • Unchartered territory • Congressional intervention
25M 20M 15M '96-'00 10M 2001 5M 0 All Cases Accounting Cases Non Accounting Cases Average Settlement Values
300 270 250 233 216 200 150 158 100 116 50 0 1997 1998 1999 2000 2001 Restatements Filed 1997 - 2001
Energy Industry and Insurance • Events in both industries have impacted the risk financing strategies of energy companies. • Energy sector consolidation and downwards credit rating trends influencing risk assessment by insurers. • P&C hard market dynamics adding pressure on enterprise risk spend.
Looking Ahead • Collective responsibility to ensure marketplace viability. • Reinforcement of long-term relationships. • Adjust perception of opportunistic enticements. • Importance of insurer credit-worthiness. • Value of insurance companies track record. • Listening and understanding what is important to each other - insurers, reinsurers, brokers and insureds.