Download
1 / 20
200 likes | 206 Views
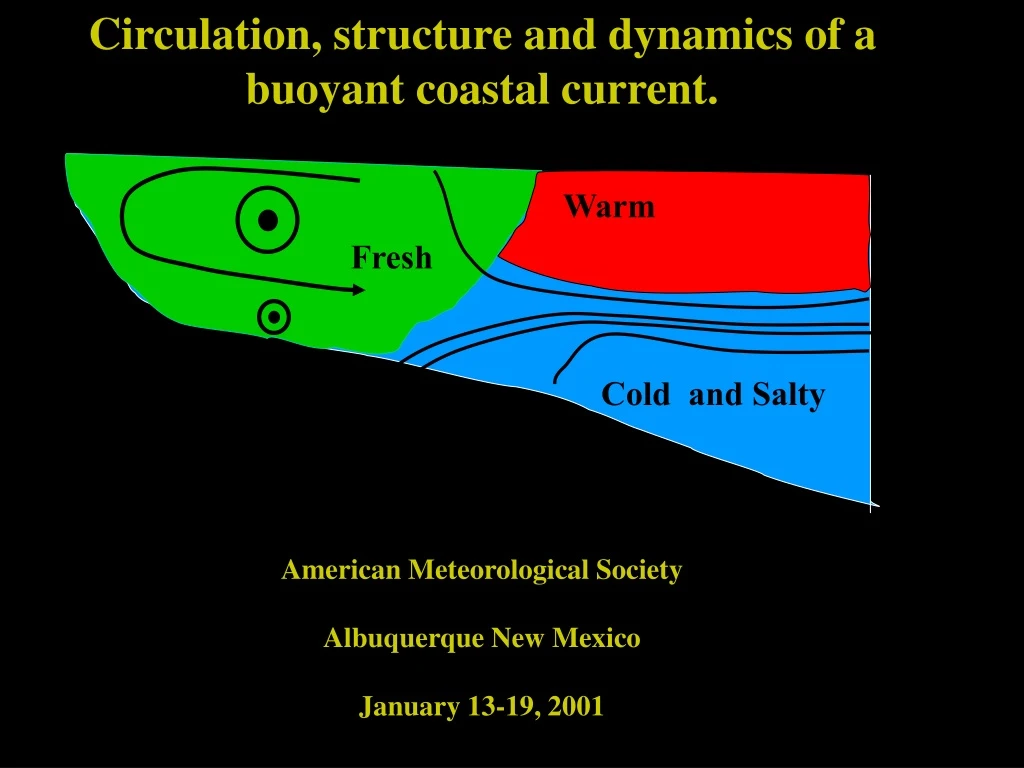
Circulation, structure and dynamics of a buoyant coastal current. Bob Chant, Scott Glenn, Phillip Bogden American Meteorological Society Albuquerque New Mexico January 13-19, 2001. Warm. Fresh. Warm. Cold and Salty. Cold. Motivation

E N D
Circulation, structure and dynamics of a buoyant coastal current. Bob Chant, Scott Glenn, Phillip Bogden American Meteorological Society Albuquerque New Mexico January 13-19, 2001 Warm Fresh Warm Cold and Salty Cold
Motivation • Characterize Circulation and Dynamics of Coastal Current • Provides target for numerical modeling • Results can be used to assess accuracy of other techniques. • -Airborne altimetery • -Turbulence Sensors • -Modeling
Pressure Gradient Coriolis Buoyant Coastal Current Warm Fresh Warm Cold and Salty Cold
Towed ADCP/CTD data-July 28, 2000 Along-Shelf (color) and Cross-Shelf (vectors) Currents. Salinity (color) and Temperature (contour)
. ADCP’s at 2,3,4,5 p-sensor & T-chain at 2 & 4 REMUS 2 REMUS 3 REMUS 4 REMUS 5
Depth AverageFlow Sectionally Averaged Flow
Sectionally averaged Along-shore Analyze Flow during Southward Flows V < -10 cm/s
Mean Flow when u < -10 cm/s f*v tb/rH ts/rH Residual 10 cm/s
~3 cm/20 km Cross Shore Flow Mean Flow (red) and Stratification (blue) (v < -10) 10 Along Shore Flow -10 10 10 -10 -10 10 4 4 -4 4 4 -4
Barotropic pressure Gradient Baroclinic pressure Gradient Coriolis Warm Fresh Cold Cold
Shear Equation Cross-Shore Momentum Equations Depth Averaged Depth Dependent
Shear Stress Eddy Viscosity
Conclusions • Surface and bottom Ekman layers are evident in “event-averaged” moored ADCP data. However, transport in the bottom layer is approximately one third of tb/rf. • Sectionally averaged fluctuating along-shore currents are geostrophically balanced. • In the near shore, weak stratification prevents bottom-stress from penetrating the entire water column. Mixing coefficients are strongest in the bottom mixed layer (10-2 m2/s), weakest in the interior (5*10-4 m2/s) and of intermediate values towards the surface (10-3 m2/s) • Fluctuating depth averaged and near bottom currents are highly • constrained by bathymetry. Surface currents are constrained by the coastline only within an internal Rossby radius from the coast.
20 cm/s 0.5 dyne/cm2
Principle Components of fluctuating currents Surface-red Bottom-Blue Depth Average-Black
Record Mean Flow f*u tb/rH Residual ts/rH 10 cm/s
Surface Stress is Red Bottom Stress is Blue Along-Shelf Stress tb>ts (despite tb underestimate) Cross-Shelf Stress