Download
1 / 22
220 likes | 382 Views
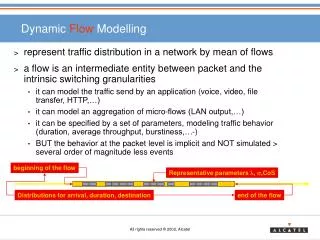
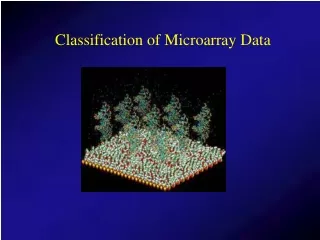
Dynamic modelling of microarray data. Martino Barenco Institute of Child Health / UCL. Outline. Goal: predict targets of a known transcription factor in a complex response using dynamic models and time course microarray data. HVDM: Hidden Variable Dynamic Modelling.

E N D
Dynamic modelling of microarray data. Martino Barenco Institute of Child Health / UCL
Outline Goal: predict targets of a known transcription factor in a complex response using dynamic models and time course microarray data. HVDM: Hidden Variable Dynamic Modelling Principle + Results (Genome Biology 2006) Techniques (R/Bioconductor implementation: rHVDM)
Sj 36 Sj 36 Bj 010 Bj 010 Dj 10.1 Dj 10.1 Gene expression model Transcript concentration Xj(t): degradationrate transcription rates Xj(t) transcription factor activity Bj=0 Sj=3 Dj=1 f(t)
Algorithm Principle: Training step: • Inputs: • Previous biological knowledge: known targets of the • transcription factor • - Expression values of those targets Output: - Transcription factor activity (the hidden variable) - Kinetic parameters for the training genes Screening step (for each single gene): • Input: • - Transcription factor activity • Expression profile of the gene Output: - Dependency status of the gene: target or not?
Training step (j: training genes) dX ( t ) j B S f ( t ) D X ( t ) = + - j j j j dt Screening step (j: individual gene being screened) dX ( t ) j B S f ( t ) D X ( t ) = + - j j j j dt
The p53 network Jun myb G2/M Arrest DNA Damage CHK2 bcl2 Survival Active p53 Fas Pidd DR5 p53 Active ATM ATM Death Receptor Bax p53AIF Puma MDM2 p19Arf Mitochondrial Apoptosis E2F1 Jun-B p21 Rb 14-3-3 Rb/E2F1 Cell Cycle G1/S Arrest CDK4 p73
Experimental setup • Human T cells (MOLT4/p53 wild-type) submitted to 5Gy irradiation. • mRNA harvested 2,4,6,8,10,12 hours after irradiation, and just before (0 hrs time point). • Affymetrix microarrays (HG-U133) were then run. • Experiment was run in triplicates.
Screening • Q: what are the other genes that are p53 activated? • Putative p53 targets must both:a) Fit the model wellb) Have a sensitivity coefficient Sj>0
P21: part of training set CD38: Uncovered by screening
Verification experiment siRNA knock down of p53: HVDM predictions:
Ingredients needed 1) ODE integrator: + parameter values 2) Model fitting: Find set of parameter values s.t. 3) Want to take measurement noise into the data into account 4) Specifically for the Bioconductor implementation: be reasonably quick
Formal solution: ODE integration - Want to estimate slope of at t=6 - Slope=weighted sum of time points around t=6 - i.e. the ODE is turned into a system of linear equations
2) Model fitting • Start with a “random” set of parameters: • Compute a solution: • Compare with data using a merit function: • Vary p systematically until a minimum value for M(p) is reached.
Fitting algorithms: • Originally used simplex-based method (Nelder-Mead) (GB paper) • Followed by a MCMC step to determine confidence intervals (GB paper) • rHVDM (Bioconductor) uses Levenberg-Marquardt (gradient-based). • By-product is the Hessian, which allows to compute confidence intervals.
Importance of confidence intervals • Biological data is inherently noisy. Don’t want to assume that measurement are exact. • example: • Genes with a flat profile would be a good fit to the equation (Sj=0) • Essential to identify these situations to detect targets of the transcription factor
Parameter count reduction / identifiability Replace f(t) with Solution: Let Sp21=1 (removes “a”’’ ambiguity) and f(0)=0(removes “b’’ ambiguity) parameter count is reduced by 2
Solution measure one of the kinetic parameters independently, integrate that in the fitting: Confidence intervals importance II Initial fitting:
Measurement error Algorithmic speed Parameter identifiability Parameter count reduction Confidence intervals
Acknowledgements Sonia Shah (Bloomsbury Centre for Bioinformatics) Dan Brewer (Institute of Cancer Research) Crispin Miller (Patterson Institute for Cancer Research) Daniela Tomescu (ICH) Mike Hubank (ICH) Robin Callard (ICH) Jaroslav Stark (CISBIC, Imperial College)