Download
1 / 26
260 likes | 464 Views
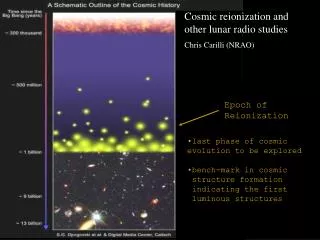
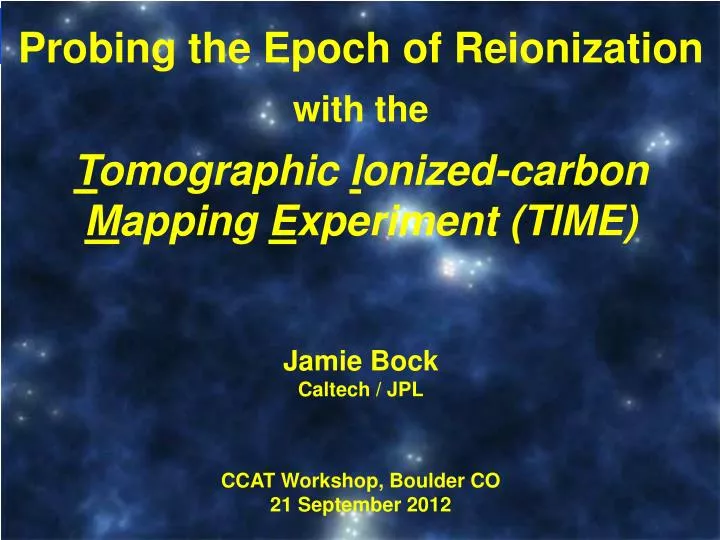
Probing the Epoch of Reionization with the T omographic I onized-carbon M apping E xperiment (TIME) Jamie Bock Caltech / JPL CCAT Workshop, Boulder CO 21 September 2012. Large Scale Structure HerMES Lockman Survey Field. 3.6°. Use Maps to Measure Clustering.

E N D
Probing the Epoch of Reionization with the TomographicIonized-carbon Mapping Experiment (TIME) Jamie Bock Caltech / JPL CCAT Workshop, Boulder CO 21 September 2012
Relationship Between Dark Matter and Galaxies Halo Clustering Model Cooray & Sheth 2002
Spatial Power Spectrum of SPIRE Maps 2-halo clustering 1-halo clustering Viero et al. arXiv 1208.5049
Advantages of Intensity Mapping • Measuring to the Galactic Ensemble • Luminosity function • Total photon production • Large-scale structure • Science Applications • Galaxy evolution • Link between dark matter and galaxy formation • Epoch of Reionization? • Baryon Acoustic Oscillations? • Observationally Expedient • Does not require a large telescope!
kSZ and Galaxies: SPIRE & mm-wave Precise Measures of kSZ and tSZ SPT Herschel/SPIRE 250 um 350 um Correlate FIR galaxies with CMB lensing projected potential: CMB lensing x CIB 500 um
Near-IR Fluctuations from the EOR? Kashlinsky et al. 2005 3.6 um 4.5 um 2p/q [arcsec] 12 x 6 arcmin 10 arcmin Akari 2.4 um 3.2 um 4.1 um Matsumoto et al. 2010
Advantages of Line Intensity Mapping • Measuring to the Galactic Ensemble • Luminosity function • Total photon production • Large-scale structure • Science Applications • Galaxy evolution • Link between dark matter and galaxy formation • Epoch of Reionization! • Baryon Acoustic Oscillations! • Observationally Expedient • Does not require a large telescope! • Does require a high-AW spectrometer
C+ Theory Predictions Simulated Sky in C+ Gong, Cooray et al. 2012, ApJ 745, 49G • C+ serves as a tracer of star formation • The clustering signal traces total luminosity • -> unlike a flux-limited galaxy survey • Use C+ to spatially trace SF during the reionization epoch
CO vs C+ CO for EOR studies: Visbal & Loeb 2010, Carilli 2011, Lidz et al. 2011, Gong et al. 2011
CO Foreground Contamination? Gong et al. 2012, ApJ 745, 49G
TIME C+ Sensitivity Predictions Poisson ±1s error in MZ – M relation Clustering Visbal & Loeb D2CO* (104)2 Lidzet al. 2011 D2CO*40002 agrees with Gong C+ model at z = 7 LCII from Visbal & Loeb 10 m Gong et al. 2012, ApJ 745, 49G
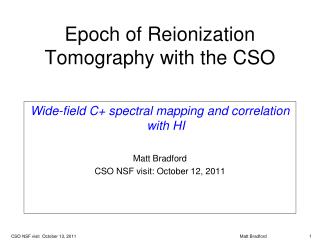
Using 21 cm & C+ Together C+ and 21 cm Cross-Correlation 2.5 arcmin • Star formation rate vs. z • Ionization state vs. z • Bubble size Gong et al. 2012, ApJ 745, 49G
TIME-Pilot Sensitivity z = 6 4.5 3.7 • Goals: • Measure C+ fluctuation amplitude • Constrain high-J CO fluctuations by cross-band correlations • Determine atmospheric noise after spectral template subtraction
Filter-Bank Spectrometer • Radiation propagates down main feed line • Resonators respond in narrow bands • Couple to power detector (MKID or TES) Credit: Jonas Zmuidzinas See talk by Matt Bradford later today!
SuperSpec: 80-Channel Test Device 7 mm Erik Shirokoff, chip design
Conclusions EOR Science accessible with a 3-m class dedicated telescope A moderate pilot experiment can probe C+ signal amplitude at lower z Develop new filter-band spectrometer technologies for CCAT
Low-NEP TES Bolometers Work with SQUID TD Mux
Power Spectra in 3 Bands Viero et al. arXiv 1208.5049
Inverted microstrip stack Erik Shirokoff, SuperSpec chip design
Obtain mm-wave redshifts (CO, C+)!! New: Galaxies with Red Colors Are they cold or at high redshift (z=4-7)? 250 um 350 um 500 um * High Redshift Galaxies in HerMES500 um peaked sources APEX ZSPEC: Bolometric spectrometer CSO *Confusion reduced S(500) – fS(250) Red Source AbundanceDowell 2011, in prep. Red Source Case Study Riechers 2011, in prep. PdBI CARMA
Use Clustering to Probe Reionization Spatial Power Spectrum Electromagnetic Spectrum Fit to Spitzer Minimum reionization See Cooray et al. 2004, Kashlinsky 2004 • Why CIBER is Robust to Systematic Errors • Zodiacal Smoothness? Observe at different times of year • Flat Field? Use difference images, lab flat • 1/f noise? Assess using sky differences • Galaxies? Large ℓ separation from EOR • Foregrounds? EOR has very different colors • Anything else? Cross-correlate with Spitzer