Download
1 / 25
250 likes | 257 Views
2013 Minnesota Wetlands Conference. Increased Ethanol Production I mpacts on Minnesota W etlands. Dr. David Kelley University of St. Thomas. 2013 Minnesota Wetlands Conference. Objective of Study.

E N D
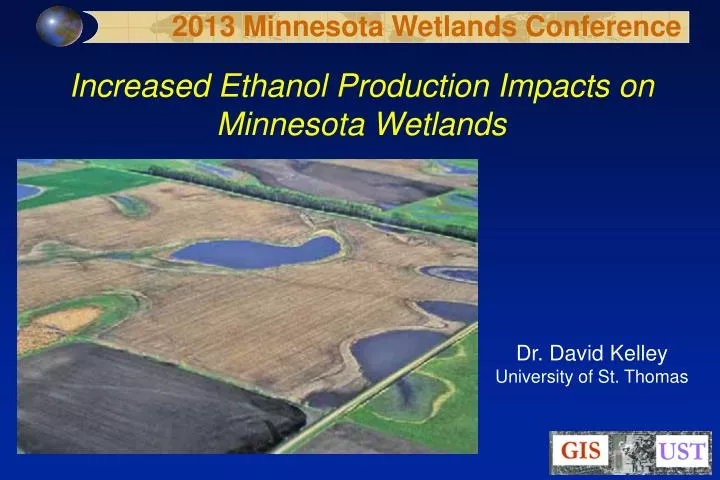
2013 Minnesota Wetlands Conference Increased Ethanol Production Impacts on Minnesota Wetlands Dr. David KelleyUniversity of St. Thomas
2013 Minnesota Wetlands Conference Objective of Study • Explore the effect that large-scale ethanol production in Minnesota has had on CRP land protection, particularly with regards to CRP contracts near surface waters.
2013 Minnesota Wetlands Conference Issues of Potential Concern • When crop prices are high and CRP rental rates are low, farmers can often make more money converting their land to crop production than keeping it enrolled in CRP. • Converting CRP acres to cropland increases soil erosion and surface runoff, degrading and filling nearby wetlands and streams with sediment. • Corn requires more pesticide input per acre than soy and most other food crops. • In landscapes dominated by corn, estimates suggest that around 17.8 to 35.7 lbs of the nitrogen applied per acre is transported to downstream aquatic ecosystems each year. • The amount of phosphorous lost from corn fields can range from 1.8 to 13.4 lbs per acre in a year.
2013 Minnesota Wetlands Conference Background USA: • 96.4 mil. acres in 2012, largest corn crop in 75 years • Corn prices can exceed $8.00/bu, Soybeans $12.00/bu • Land under CRP contract for the 2008 crop year: 34.66 million acres, down 2.11 million acres from 36.77 million acres in 2007. • States with the largest CRP declines: North Dakota and South Dakota, with losses of 400,000 and 248,000 acres, respectively. Source: USDA, 2008
2013 Minnesota Wetlands Conference • The Conservation Reserve Program (CRP) The CRP works to protect environmentally-sensitive farmland voluntarily submitted into the program. To determine which lands are eligible, the CRP uses an Environmental Benefits Index (EBI), which scores a parcel of land on various criteria for suitability for protection (proximity to water, rare or endangered species, slope, etc.).
2013 Minnesota Wetlands Conference CORN Source: Agricultural Marketing Services Division, MN Department of Agriculture, 2008
2013 Minnesota Wetlands Conference Source: Agricultural Marketing Services Division, MN Department of Agriculture, 2008
2013 Minnesota Wetlands Conference Minnesota’s Top Corn Counties, 1990 & 2007 Production Source: Agricultural Marketing Services Division, MN Department of Agriculture, 2008
2013 Minnesota Wetlands Conference Minnesota Corn Prices Received by Growers (monthly, $/bushel) Source: Agricultural Marketing Services Division, MN Department of Agriculture
2013 Minnesota Wetlands Conference Minnesota Corn Utilization Source: Agricultural Marketing Services Division, MN Department of Agriculture, 2008
2013 Minnesota Wetlands Conference Minnesota Corn Processing (million bushels) Source: Agricultural Marketing Services Division, MN Department of Agriculture, 2008
2013 Minnesota Wetlands Conference U.S. Ethanol Production $7.20 - $8.60 /bucorn Sept. 2012 Source: Renewable Fuels Association, 2013
2013 Minnesota Wetlands Conference Minnesota: • 1997: 10% ethanol blend; 2005: 2% biodiesel blend • 2013: 20% ethanol blend Source: MDA, 2013
2013 Minnesota Wetlands Conference Million gallons Source: Agricultural Marketing Services Division, MN Department of Agriculture, 2013
2013 Minnesota Wetlands Conference GIS uses the power of a computer and specialized software to stack different maps and data layers on top of each other so that they can be compared and analyzed. • Data layers used: • Minnesota Conservation Reserve Program (CRP) GIS Database; 1997 (pre-ethanol) and 2008 (post-ethanol) • Ethanol BiorefineryLocations 2012 (Renewable Fuels Association) • 2010 Stream Assessments (MPCA) • Lakes from the USGS 1:100,000 Digital Line Graph Hydrography Layer(MDNR) • Base imagery from ESRI (Digital Globe, FSA)
2013 Minnesota Wetlands Conference Initial Observations: Yellow denotes CRPacreage lost between1997 and 2008 (742 acres)Red denotes CRPacreage gained between1997 and 2008 (537 acres) within 5 miles of theCentral MN Ethanol Coop,Little Falls, MN(Morrison county)
2013 Minnesota Wetlands Conference Closeup of CRPacreage lost between1997 and 2008, just west of theLittle Falls ethanol plant. Note proximity to surface waters.
2013 Minnesota Wetlands Conference Comparison of 1997 and 2008 CRP acres within 0.25 mi. of surface water body or stream(sub-section of Kandiyohi county)
2013 Minnesota Wetlands Conference Changes to MN CRP acreage within 0.25 mile of assessed streams or lakes between 1997 and 2008.
2013 Minnesota Wetlands Conference Conclusions • CRP enrollment has increased overall between 1997 and 2008 in Minnesota • Up to 10% of 1997 CRP acres near water lost by 2008 • Corn prices may affect future CRP enrollment decisions