Download
1 / 50
500 likes | 634 Views
Monitoring migrating fish in rivers. Helge Balk Department of Physics. University of Oslo. Special tools for rivers. Introduction. Sonar5 and river work. Analysis chain. TS. Discussion. Acoustics in rivers. DPF. Meaning of an observation. Interpretation. TS and positioning.

E N D
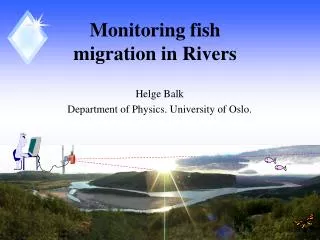
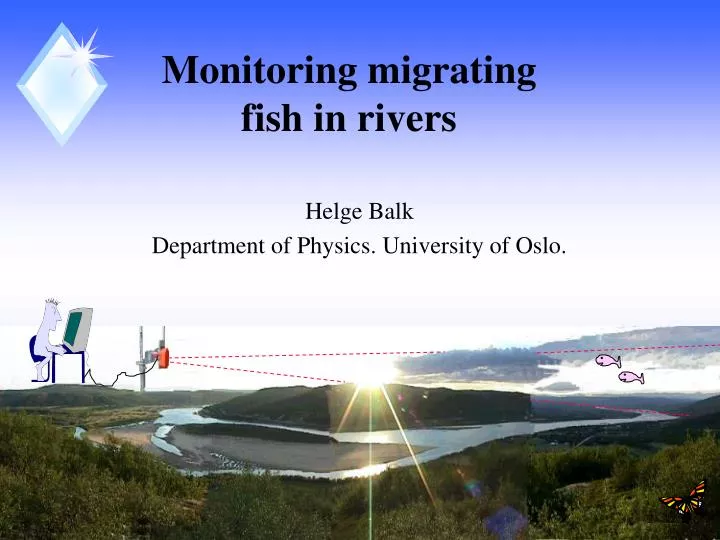
Monitoring migrating fish in rivers Helge Balk Department of Physics. University of Oslo.
Special tools for rivers Introduction Sonar5 and river work Analysis chain TS Discussion Acoustics in rivers DPF Meaning of an observation Interpretation TS and positioning Time and area expansion Noise Sound propagation Noise and DPF Measurements in Fisca (Au) Waves Current, stones, rain Observations in Tana and Rimov Hydrophone experiments
Sonar5 tools for river work • Current profile • Bottom profile • Exact target positioning • Transducer positioning • Diurnal coverage
Position diagram can present the water current Popup menu Important to see whether a track moves against the current or not
Position diagram exact position and bottom profile • Draw bottom with a pencil • Move or tilt transducer • Raise and lower water level • Measure distances Popup menu Demonstrate it?
Description of the sonar file Control the current, bottom profile, and transducer placement
Sound propagation • Estimate sound propagation features • Estimate “true” target position and beam behaviour
Site calculator Assist in describing the transducer position Originally developed to find the same position each year in River Tana
Diurnal coverage and file information Advanced file open dialog looks into the files and estimate diurnal coverage Individual description and photo from each file can be presented as well
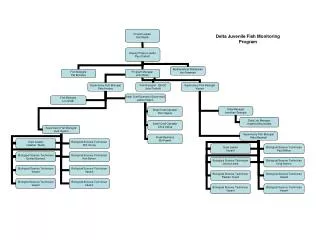
River analysis chain in Sonar5-pro beam mapping transducer position and alignment TS / aspect / length regressions Cross filter detector Cross filter tracker Size correction River co-ordinates x,y,z Track Aspect angle detection Feature extraction 10,3,4,7 Classification Interpretation Echo sounder • Split and rule • Focus on detecting as many echoes as possible from all targets. Fish, debris and stones • Focus on generating tracks from all targets, not only fish • Classify tracks
Special tools for rivers Introduction Sonar5 and river work Analysis chain TS Discussion Acoustics in rivers DPF Meaning of an observation Interpretation TS and positioning Time and area expansion Noise Sound propagation Noise and DPF Measurements in Fisca (Au) Waves Current, stones, rain Observations in Tana and Rimov Hydrophone experiments
If we detect a fish, What does it mean? Echo sounder Fish detection software ?
Interpretation: DPF, noise and time expansion Echo sounder Fish detector Interpreter Meaningful statistics Measure noise level as a function of time and range over years Apply noise level as an overall fish size threshold Use noise level to correct the number of fish within each size group Apply time expansion to find the total fish abundance estimate
What did we cover? Interpretation: Area expansion ! Echo sounder Fish detector Interpreter Meaningful statistics! Where did the fish pass? Index or total run?
Special tools for rivers Introduction Sonar5 and river work Analysis chain TS Discussion Acoustics in rivers DPF Meaning of an observation Interpretation TS and positioning Time and area expansion Noise Sound propagation Noise and DPF Measurements in Fisca (Au) Waves Current, stones, rain Observations in Tana and Rimov Hydrophone experiments
What is the main problem with fish counting in rivers… Noise ,Noise and Noise What can be worse than noise? Variable noise Why? Variable detection probability
Detection Probability Function (DPF ) • Varies with • Time • Range • More likely to detect • a large fish than a small fish • a fish when the noise level is low • a fish in the centre of the beam • a fish passing normal towards the transducer • a fish if the cross section coverage is increased Noise as a function of range Noise as a function of time
Rimov experiment, water current Observed: Increased reverberation Shift in target positionreduced stability in TS estimates
Special tools for rivers Introduction Sonar5 and river work Analysis chain TS Discussion DPF Acoustics in rivers Meaning of an observation Interpretation Time and area expansion Sound propagation Noise Noise and DPF In River Tana Hydrophone experiments Observations In Rimov
Strange observations in River Tana We observed that the target was visible from the moment it touched surface On the outside of the boat Until it was laying on the bottom
Summary of observations in River Tana • Target observed far outside the theoretical beam • Target strength observed to increase with range • No clear beam pattern was found at any tested range • Vertical phase reading seemed corrupted • Horizontal phase reading seemed fine • Returned echo length observed to be 1.5 times the transmitted pulse-length
Strange observations in Rimov Looked like a second beam under the existing beam
Summary of observations in Rimov • Target observed outside the theoretical beam • The target behaved normally within the position of the theoretical beam • A second beam was observed under the first beam • The under beam’s intensity show the same profile as the main beam, but with weaker echo intensity • The under beam’s angle estimates show a narrower opening angle than the main beam • A transition region was observed between the two beams at shorter range. At longer range the two beams melted together into one wide beam • Echo-pulse-length did not differ from the transmitted pulse-length • The transducer depth and tilt influenced the phenomenon • The phenomenon depended on the transducers opening angle • The phenomenon varied with range
What causes the observed phenomena? • Refraction and reflection • Sound channels and waveguides • Image interference • Dipole effect • Side lobe effect
Direct sound measurements Show separate presentation
Special tools for rivers Introduction Sonar5 and river work Analysis chain TS Discussion Acoustics in rivers DPF Meaning of an observation Interpretation TS and positioning Time and area expansion Noise Sound propagation Noise and DPF Measurements in Fisca (Au) Waves Current, stones, rain Observations in Tana and Rimov Hydrophone experiments
Target detection possible Parametric SED Crossfilter SED
Lifting target from bottom to surface. Positioning and sizing? AMP, TSu versus ping SED, TSc versus ping
Special tools for rivers Introduction Sonar5 and river work Analysis chain TS Discussion Acoustics in rivers DPF Meaning of an observation Interpretation TS and positioning Time and area expansion Noise Sound propagation Noise and DPF Measurements in Fisca (Au) Waves Current, stones, rain Observations in Tana and Rimov Hydrophone experiments
What can we do with the detection probability Estimate the DPF Reduce the variation in the DPF Site selection Bottom modification Surface modification Guide fish Opening angle Sound frequency
Can we estimate TS in a river? • Spherical or cylindrical spreading? • Corrupted vertical angular measurements? • Additive noise? • Can we compensate for swimming motion? • Can we compensate for fish aspect?
Can we estimate TS in a river? Alternative methods to establish the size? Beam intensity mapping? Apply reference targets? Multiple narrow beams? Multiple frequencies? Aspect detection and correction?
Tracking principles • Split and rule • Focus on detecting as many echoes as possible from all targets. Fish, debris and stones • Focus on generating tracks from all targets, not only fish • Classify tracks • Interpret counting result
Bottom profile Preparation Study test recordings Noise level Bottom line detection Fish counting Pre-analysis Cross filter SED detection Analysis Interpretation Area expansion Crossfilter tracking Noise level analysis Time expansion Track classification Track size estimation
Pre-Analysis • Use “vertical” bottom detection to avoid analysis of the outer noisy range. • Low-pass filter to reduce noise • Cross-filter detector to detect single targets
Analysis • Manual tracking and classification, Too subjective? • Cross filter tracking • Automatic or manual classification • Fish baskets, track storing and track sorting • Track statistics
Outline • Noise • Experiments with rain, waves, stones, current… • Detection probability function • Sound propagation observations • Refraction and reflection • Tana and rimov phenomenon • Direct hydrophone measurements • What about target strength? • Observations in River Fischa (Au) • Interpretation of results • Our analysis procedure for rivers • What we have learned about tracking • Split and rule • Manual tracking is subjective and time consuming • Amp echogram is important • Tools supporting river applications in Sonar5-Pro • Discussion