Download
1 / 25
260 likes | 469 Views
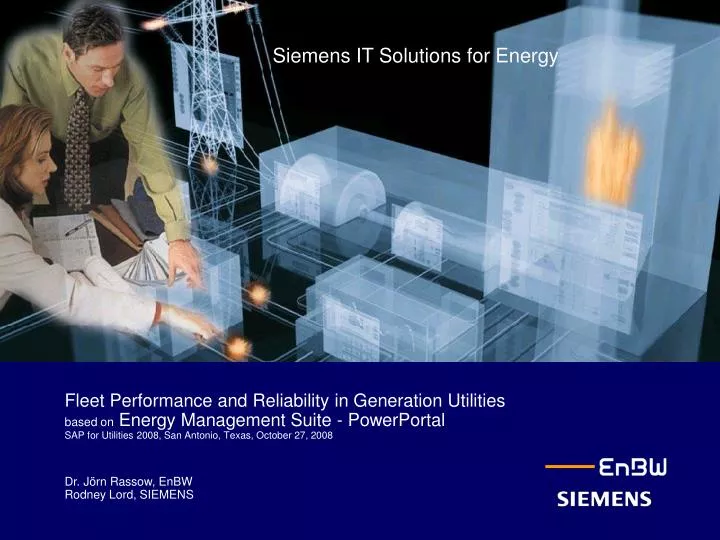
Siemens IT Solutions for Energy. Fleet Performance and Reliability in Generation Utilities based on Energy Management Suite - PowerPortal SAP for Utilities 2008, San Antonio, Texas, October 27, 2008 Dr. Jörn Rassow, EnBW Rodney Lord, SIEMENS. Solution architecture. Company profile.

E N D
Siemens IT Solutions for Energy Fleet Performance and Reliability in Generation Utilitiesbased on Energy Management Suite - PowerPortal SAP for Utilities 2008, San Antonio, Texas, October 27, 2008Dr. Jörn Rassow, EnBWRodney Lord, SIEMENS
Solution architecture Company profile Realised Project from Clients View Motivation Project information Project results & Outlook Energy Management Suite PowerPortal@EnBW Agenda
EnBW AG- Organizational & production structure EnBW AG Generation Trading Sales Transmission Service EnBW Kraftwerke AG ~ 12.000 MW contractual fossil hydro-electrical nuclear
1998 … 2003 Merger of grid operating companies with local utilities and municipal utility + + Start of de-regulation of the german energy market Consequences / changes for EnBW: • Re-orientation in the new market situation • new company organization • new tasks / organizational company structures of group companies Requirements for EnBW Kraftwerke: … the implementation of a unified reporting based on the existing inhomogeneous information platform … the unification of business processes Motivation- Needs for a innovative Information Platform
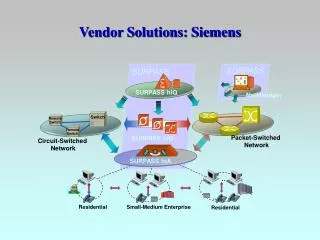
Solution architecture- innovative system structure Role-based portal content structure PowerPortal SAP Enterprise Portal iView Event-driven communication iView iView Adapter SIEMENS Cockpit Data model Displays Calculations Alarming & Notification Data storage Adapter Adapter Adapter Adapter Record set Record set Record set Time series / VTQ-Values XML-files LoB Database ERP I & C
Solution architecture- secure plant system environment Backend system load t Backend system load t Stabile system operation and high performance no Risk of instable system behavior caused by users! HQ SAP EP Siemens Cockpit No. of users : >> 100 ! Pre-defined update cycle Maximum system load System load Plant location Process data archive DCS
Efficient Management of a mixed Generation Portfolio Course of the Project „PowerPortal for conventional Power plants“ Decision: implementation of PowerPortal for EnBW’s conventional power plants in • - Altbach, • - Heilbronn, Marbach, Walheim, • - Karlsruhe, • Stuttgart-Münster, Stuttgart-Gaisburg and • Central service / HQ Visualization of technical and commercial information June 2004 Start feasibility study (requirements analysis) July 2005 Contract placement Phase 1 (Pilot: Karlsruhe/HQ) April 2006 Phase 2 March 2007 Engineering, commissioning, testing period May 2007 Final acceptance ~Aug 2007 User driven optimization
Efficient Management of a mixed Generation Portfolio Project Approach • 3-step Process analytics • Analysis of present state (Bottom-Up) • Analysis of location-based differences • Cross-check: • Top-Down analytics based on EnBW process model Process description Structured representation and documentation: Scope on all major processes Navigational structure Description of tasks and targets Determination of data sources and IT-systems Page design (Layout, tables, …) Data structure Data provider Determination of update cycles Business roles Determination of users
Efficient Management of a mixed Generation Portfolio Design of a company-wide data model Modeling Calculations, conditions, … Process Data elements Samples: Current value 15-min average value 1-h average value 1-h flowing average value Precision: Measurement/Counter Raw value, checked, …
Efficient Management of a mixed Generation Portfolio Business roles: task-oriented contents Business area drives PowerPortal user assigns Task Content defines SIEMENS Cockpit Role • Page data • Navigation SAP Enterprise Portal KWGV : KWG management board RDKL : RDK power plant management HLBPR : HLB production manager ZSTE : Central service / technical etc. : . . .
Efficient Management of a mixed Generation Portfolio Company overview (Dashboard) Data sources SAP BW MS Access Cockpit BHN OSI PI
Efficient Management of a mixed Generation Portfolio Production Monitoring location time unit 4 Production Emissions KPI’s Environmt. Events Net Generation Station Supply District Heating Accumulated production Electricity Heat
Efficient Management of a mixed Generation Portfolio Detailed Trend Analysis
Efficient Management of a mixed Generation Portfolio Environmental Values and Trends location time Production Emissions KPI’s Environmt. Events river temperature 3 3 cooling water - heating cooling water - outlet temperature
Efficient Management of a mixed Generation Portfolio Production: KPI’s (availability, detailed structured analysis) location month operation time analysis work analysis dispatcher view low load / high load events graphs Nominal energy energy availability factor Available energy not available energy unplanned planned
Efficient Management of a mixed Generation Portfolio Maintenance: KPI’s (orders, detailed structured analysis) production orders operation Statistics maintenance orders orders analysis notific. analysis techn. KPI’s comercial KPI’s reports general order details
Efficient Management of a mixed Generation Portfolio experiences and success factors User-related • Improved exchange of information • between power plants and • between power plants & headquarter • Increasing awareness for causal dependencies (technical <-> commercial) • Many users have access to information on all power plants • Data quality is very important • For general user acceptance information areas must be completely transferred into • the new portal environment Administrative Even a fully automated data supply requires system support The data flow based on numerous backend systems requires a change management As for all applications a user management is required (sensitive information) Due to easy usage of the PowerPortal only little hotline support is required General The easy access to a huge number of information causes needs for changing previously event-driven data collections ( e.g. once per month ) into a permanent available data flow. It is recommended to provide data in databases.
Efficient Management of a mixed Generation Portfolio Future extensions of the EnBW PowerPortal Presently „PowerPortal“ is implemented for all conventional power plants. Functional extensions for conventional power plants Dec. 2007 Contract placement feasibility study Focus on: environmental data, plant optimization, cross-plant information, … Nov. 2008 Contract Placement “Functional Extensions” „PowerPortal“ for hydro-electrical power plants Jan 2007 feasibility study “Hydro-electrical power plants” Nov 2008 Contract placement „PowerPortal Hydro-electrical power plants“ „PowerPortal“ for nuclear power plants 2009 Contract placement feasibility study PowerPortal will than serve as an online information platform for the whole generation portfolio of EnBW comprising fossil (coal, oil, gas), nuclear, hydro-electrical and other (waste-firing) power plants
Infonet Hydrology und Water Management Energy Management Energiewirtschaft Operation Information Overview Regions Rivers Running Water detailed navigation • Overview • running water • pumped storage • EEG Rockenau operational condition Machine 1 off 2 operation electrical gross generation since 1. Jan : 111 MWh actual electrical gross generation : 22 MW • Regions • Schwarzwald / Rhein 312 MW • Iller / Donau 258 MW • Oberer Neckar 111 MW • Unterer Neckar 168 MW Display sample from feasibility study: PowerPortal for hydro-electrical Power Plants click on location „Rockenau“ • Rivers • Rhein 312 MW • ▪Elz 5 MW • ▪Murg 86 MW • ▪Raumünz 8 MW • ▪Neckar 279 MW • ▪ Enz 29 MW • ▪Nagold 11 MW • ▪Glatt 7 MW • ▪Jagst 12 MW • ▪Kocher 21 MW • Donau 58 MW • ▪Iller 89 MW
Energiewirtschaft Regionen Flüsse Übersicht pump storage station Glems • Overview • Region 1 • Region 2 • Region 3 • Region 4 Techn. actual Nominal generation purchase Operation hours capability operational cond. Gross gener. generation since 1.Jan. seit 1.1. Pump Turbine hydr. KS upper basin M1 operation 22 MW 25 MW 1111 h 2222 h 555 h M2 off 0 MW 25 MW 1111 h 2222 h 555 h Sum 22 MW 22 MW 333 GWh 555 GWh 111 MWh • all Regions • Feudenheim • Schwabenheim • Heidelberg • Neckargemünd • Neckarsteinach • Hirschhorn • Rockenau • Guttenbach • Neckarzimmern • Gundelsheim • Kochendorf • Glems Leistung [MW] 150 100 50 0 -50 -100 12:00 18:00 00:00 06:00 12:00. M1 M2 Summe El. output - sum - 22 MW El. output 22 MW turbine in operation El. output 0 MW off Aggregated el. output since 1.Jan. : 111 GWh Aggregated el. purchase since 1.Jan. : 222 GWh Infonet Hydrology und Water Management Energy Management Energiewirtschaft Operation Information Overview Regions Rivers detailed navigation Display sample from feasibility study: PowerPortal for hydro-electrical Power Plants
261,0 m3/s 261,0 m3/s 261,0 m3/s 261,0 m3/s 0.5 MW 0.5 MW 8.1 MW 8.1 MW Outlet [m3/s] Abfluss [m3/s] Abfluss [m3/s] Outlet [m3/s] Outlet [m3/s] 25 25 25 25 25 20 20 20 20 20 15 15 15 15 15 10 10 10 10 10 5 5 5 5 5 0 0 0 0 0 02.10. 02.10. 02.10. 02.10. 02.10. 03.10. 03.10. 03.10. 03.10. 03.10. 04.10. 04.10. 04.10. 04.10. 04.10. 05.10. 05.10. 05.10. 05.10. 05.10. 06.10. 06.10. 06.10. 06.10. 06.10. 07.10. 07.10. 07.10. 07.10. 07.10. 08.10. 08.10. 08.10. 08.10. 08.10. Infonet Hydrology und Water Management Energy Management Operation Information Region 1 Region 1 Region 2 Region 2 Region 4 Region 4 Region 3 Region 3 Flüsse Rivers Iller Power Plants Iller detaled navigation • Iller power plants • ODK • small power plants Tannheim Unteropfingen Dettingen • overview • Dettingen • Unteropfingen • Tannheim • Mooshausen • Aitrach • Arlacher Wehr • Kirchdorfer Wehr 101,0 m3/s 101,0 m3/s 101,0 m3/s 101,0 m3/s 101,0 m3/s 101,0 m3/s 5.5 MW 5.5 MW 5.5 MW 5.5 MW 5.5 MW 5.5 MW 540,60 540,60 101,0 m3/s 101,0 m3/s 584,31 584,31 566,41 566,41 548,37 548,37 566,50 566,50 566,52 566,52 548,82 548,82 533,09 533,09 548,46 548,46 4,5 m3/s 4,5 m3/s 4,5 m3/s 4,5 m3/s 4,5 m3/s 4,5 m3/s Display sample from feasibility study: PowerPortal for hydro-electrical Power Plants 4,5 m3/s 4,5 m3/s 4,5 m3/s 4,5 m3/s 584,12 584,12 Qges Qges 584,36 584,36 567,79 567,79 551,35 551,35 594,82 594,82 181,0 m3/s 181,0 m3/s 578,65 578,65 0,00 0,00 594,86 594,86 584,55 584,55 181,0 m3/s 181,0 m3/s 181,0 m3/s 181,0 m3/s Aitrach Mooshausen Arlacher Weir Kirchdorfer Weir Qges Sonthofen LEW 8 13,5 m3/s 13,5 m3/s 30,0 m3/s 30,0 m3/s
Marbach Pleidelsheim Hessigheim Besigheim Lauffen Horkheim Heilbronn Kochendorf Gundelsheim 27 m3 / s 777 kW 333 kW 444 kW 27 m3 / s 888 kW 111 MW 222 MW 333 kW 444 kW 27 m3 / s 777 MW 333 MW 444 MW 27 m3 / s 777 kW 333 kW 444 kW 27 m3 / s 777 kW 333 kW 444 kW 27 m3 / s 777 kW 333 kW 444 kW 27 m3 / s 777 kW 333 kW 444 kW 27 m3 / s 999 kW 222 kW 333 kW 444 kW 27 m3 / s 777 kW Guttenbach Rockenau Hirschhorn Neckarsteinach Neckargemünd Heidelberg Schwabenheim Feudenheim 27 m3 / s 777 kW 333 kW 444 kW 27 m3 / s 27 m3 / s 777 kW 333 kW 444 kW 27 m3 / s 777 kW 0 MW 0 MW 333 kW 444 kW 27 m3 / s 777 kW 333 kW 444 kW 27 m3 / s 777 kW 333 kW 444 kW 27 m3 / s 999 kW 222 kW 333 kW 444 kW 27 m3 / s 777 kW 333 kW 444 kW Infonet Hydrology und Water Management Energy Management Operation Information Region 1 Region 1 Region 2 Region 2 Region 4 Region 4 Region 3 Region 3 Rivers Flüsse Neckar (diagram) detailed navigation • Neckar actual electrical power „Neckar“ : 12.3 MW actual outlet „Feudenheim“ : 123 m3 / s Deizisau Oberesslingen Esslingen Obertürkheim Untertürkheim Cannstatt Hofen Aldingen Poppenweiler 27 m3 / s 777 kW 333 kW 444 kW 27 m3 / s 777 kW 333 kW 444 kW 27 m3 / s 27 m3 / s 777 kW 333 kW 444 kW 27 m3 / s 777 kW 0 MW 0 MW 333 kW 444 kW 27 m3 / s 777 kW 333 kW 444 kW 27 m3 / s 777 kW 333 kW 444 kW 27 m3 / s 999 kW 222 kW 333 kW 444 kW 27 m3 / s 777 kW 333 kW 444 kW ~~> Display sample from feasibility study: PowerPortal for hydro-electrical Power Plants ~~> Kocher Jagst Enz 27 m3 / s 27 m3 / s 27 m3 / s Neckarzimmern 27 m3 / s 777 kW 333 kW 444 kW ~~>
Efficient Management of a mixed Generation Portfolio EnBW PowerPortal key figures • Status of project: • One PowerPortal for • 7 conventional locations and KWG headquarter • 12 different backend systems as data sources • ca. 400 portal pages • ca. 12.000 data elements • over 200 employees have access to the portal • required training & information effort ( EnBW-internal ) • 5 general information events for each main location • 18 introduction courses (~ 2,5 h each)
Efficient Management of a mixed Generation Portfolio Conclusion Most important ... • Sound basis for decision makeron up-to-date and verified information • Accelerated business processesdue to views on coherent technical and commercial data • Low costsdue to continued usage of existing systems • Littlehotline and IT-service effort due to the usage of standard browsers as client-tool ... and additionally ... • Process optimization by the support of benchmarking • Fast, well-founded decisions, e.g. by “best practice sharing” • Advantage on better information based on data from different expert systems • Increased awareness on commercial relations and dependencies • Reduced effort for information retrieval • Improved productivity and easy usageby user-specific tailored access to information • Improved motivation of the employees by working on the system • Internet-based data access for entitled EnBW-employees
Thank you for your attention ! Fleet Performance and Reliability in Generation Utilitiesbased on Energy Management Suite - PowerPortal SAP for Utilities 2008, North American Conference, San Antonio, Texas, October 27, 2008Dr. Jörn Rassow, EnBWRodney Lord, SIEMENS