Download
1 / 36
360 likes | 363 Views
Explore how Opportunity Insights is using big data to assess and address the low rates of upward mobility in Charlotte. Discover their scalable policy solutions and collaborative approach to empowering families out of poverty.

E N D
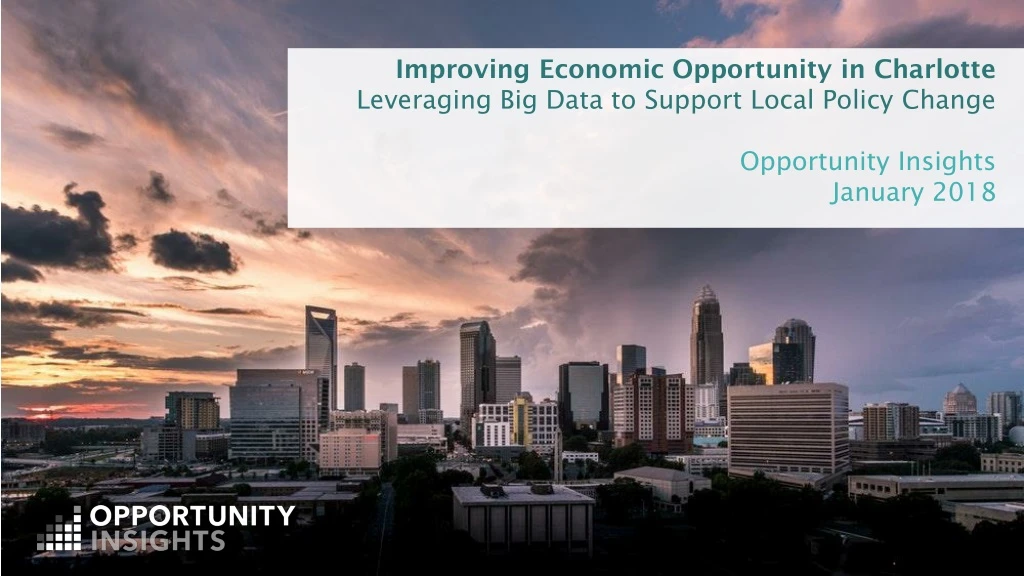
Improving Economic Opportunity in Charlotte Leveraging Big Data to Support Local Policy Change Opportunity Insights January 2018
The Fading American Dream Percent of Children Earning More than Their Parents, by Year of Birth 100 90 80 Pct. of Children Earning more than their Parents 70 60 50 1940 1950 1960 1970 1980 Child's Year of Birth Source: Chetty, Grusky, Hell, Hendren, Manduca, Narang (Science 2017)
The Geography of Opportunity in Charlotte Children raised in low-income families in Charlotte-Mecklenburg County have among the lowest rates of upward mobility in the U.S. Kids raised in families at the 25th percentile have average household incomes of $26,000 as adults.
How Can We Restore the American Dream? Our mission: develop scalable policy solutions that will empower families throughout the U.S. to rise out of poverty and achieve better life outcomes Combining rigorous, scientific research with local partnerships • Our work supports and builds on existing community initiatives
Approach to Improving Opportunity Using Big Data to Provide Targeted Diagnoses and Advice Upward Mobility 1. Assessment 2. Policy Pilots 3. Evaluation Identify areas where opportunity is lacking Evaluate impact and disseminate lessons Scalable policies to increase mobility Work with local stakeholders on interventions
Approach to Improving Opportunity Using Big Data to Provide Targeted Diagnoses and Advice Upward Mobility • 1. Assessment • 2. Policy Pilots • 3. Evaluation
Upward Income Mobility vs. Average Incomes Across Neighborhoods Low income, High opportunity High income, High opportunity High income, Low opportunity Low income, Low opportunity Median Household Income of Residents in 2016
High Income, High Opportunity Neighborhoods Median Household Income of Residents in 2016
Low Income, Low Opportunity Neighborhoods Median Household Income of Residents in 2016
Low Income, High Opportunity Neighborhoods Median Household Income of Residents in 2016
High Income, Low Opportunity Neighborhoods Median Household Income of Residents in 2016
Low-Income Neighborhoods in Charlotte Tracts with below-median 2016 Mecklenburg household-income ($61,600)
Low-Income Neighborhoods with High Upward-Mobility Rates Below-Average Household Income Above-Average Upward Mobility Rates
Low-Income Neighborhoods with High Upward-Mobility Rates Below-Average Household Income Above-Average Upward Mobility Rates Top 25% Increase in Avg. Income from 1990-2016
Low-Income Neighborhoods with High Upward-Mobility Rates Below-Average Household Income Above-Average Upward Mobility Rates Top 25% Increase in Avg. Income from 1990-2016 East Forest
Change in Low-Income Population of Color Percent Change 2000 to 2010 In Black and Hispanic PopulationBelow the Poverty Line < -1% 0.80% > 7.2%
Approach to Improving Opportunity Using Big Data to Provide Targeted Diagnoses and Advice Upward Mobility • 1. Assessment • 2. Policy Pilots • 3. Evaluation
Focus on Three Leading on Opportunity Task Force Priorities Housing Strategy P Social Capital Strategy U Higher Education Strategies F, G, I, J, K
Focus on Three Leading on Opportunity Task Force Priorities Housing Strategy P Social Capital Strategy U Higher Education Strategies F, G, I, J, K
Is Affordable Housing in Charlotte Maximizing Opportunities for Upward Mobility? Most Common Current Locations of Families Receiving Housing Vouchers • Most Common Locations of • Housing Choice Voucher • Holders
Creating Moves to Opportunity Pilot study to help families with housing vouchers move to high-opportunity areas in Seattle using three approaches: • Providing information to tenants • Recruiting landlords • Offering housing search and financial assistance for moving
Location of affordable housing programs Proposed Housing Development Locations. (Yellow dots are city owned land) Most Common Locations of Housing Choice Voucher Holders Historic LIHTC Developments > $56k < $16k $34k Avg income at Age 35 of children who grew up in low-income families
Affordable Neighborhoods with High Upward-Mobility Rates • Affordable Opportunity Areas • rent below county median ($1361) • above average upward mobility rates
The difference housing can make Lifetime Earnings Gained from moving to different areas of Charlotte From low opportunity area 300,000 $275,159 250,000 200,000 $135,465 150,000 100,000 $53,174 50,000 0 Move to Move to Move to low-rent high-opp high-rent high-opp Proposed Devs
Housing: Opportunities for Partnerships to Improve Opportunity Housing Opportunity Investment Fund Charlotte Housing Authority City of Charlotte
Focus on Three Leading on Opportunity Task Force Priorities Housing Strategy P Social Capital Strategy U Higher Education Strategies F, G, I, J, K
Social Capital: Research Background Areas with greater social capital tend to have greater upward mobility Black father presence on a community level is correlated with the future earnings of black boys (but not black girls) • Exposure to inventors during childhood makes children more likely to become inventors themselves
Social Capital Programs in Charlotte Y Achievers & Level Up New My Brother’s Keeper initiative Social capital pledges and doses, as well as youth social capital Networks of pastors & centralized volunteer technology platform Other Programs 100 Black Men of Charlotte • Boys to Men Foundation • EmpowHERment • Circle de Luz • Firm Foundation • H.O.P.E 4 Humanity Inc. • Bright Futures • time4change/mentor4change • Big Brothers Big Sisters Charlotte
Social Capital Programs in Other Cities • BAM and Credible Messengers: clinical mentoring programs focused on reducing violence and incarceration • Peer forward: older students provide younger students with college application guidance and support • Harmony Project: mentoring young children through music
Focus on Three Leading on Opportunity Task Force Priorities Housing Strategy P Social Capital Strategy U Higher Education Strategies F, G, I, J, K
Collegiate Leaders in Increasing Mobility • Opportunity Insights is working with a network of almost 400 colleges and universities to: • Increase access to qualified low-income students • Maximize the success of students from disadvantaged backgrounds
Upward Mobility vs. Low-Income Access by College CPCC: High Access, Low Upward Mobility 12.3% of CPCC’s students comes from families in the bottom fifth, typical for a two-year college But only 7.2% of those students reach the top fifth when they are adults 100 80 60 Percent of Students from Bottom 20% who Reach Top 20% Upward Mobility Rate Central Piedmont Community College 40 20 0 0 20 40 60 Low-Income Access Percent of Students from Families in Bottom 20%
Upward Mobility vs. Low-Income Access by College 100 80 60 Percent of Students from Bottom 20% who Reach Top 20% Upward Mobility Rate Central Piedmont Community College 40 20 0 0 20 40 60 Low-Income Access Percent of Students from Families in Bottom 20%
Upward Mobility vs. Low-Income Access by College UNCC: Low Access High Upward Mobility Only 6.4% of UNCC’s students comes from families in the bottom fifth, typical for a two-year college But 25% of those students reach the top fifth when they are adults 100 80 University Of North Carolina - Charlotte 60 Percent of Students from Bottom 20% who Reach Top 20% Upward Mobility Rate Central Piedmont Community College 40 20 0 0 20 40 60 Low-Income Access Percent of Students from Families in Bottom 20%
Working Together to Create Impact • Low rates of upward mobility in Charlotte are tied to a long history of segregation and a lack of supportive systems for low-income residents • One initiative alone will not transform Charlotte into a high mobility community.