Download
1 / 58
580 likes | 695 Views
http://ochousingnews.com/ - Entertaining and Insightful Housing Market Analysis

E N D
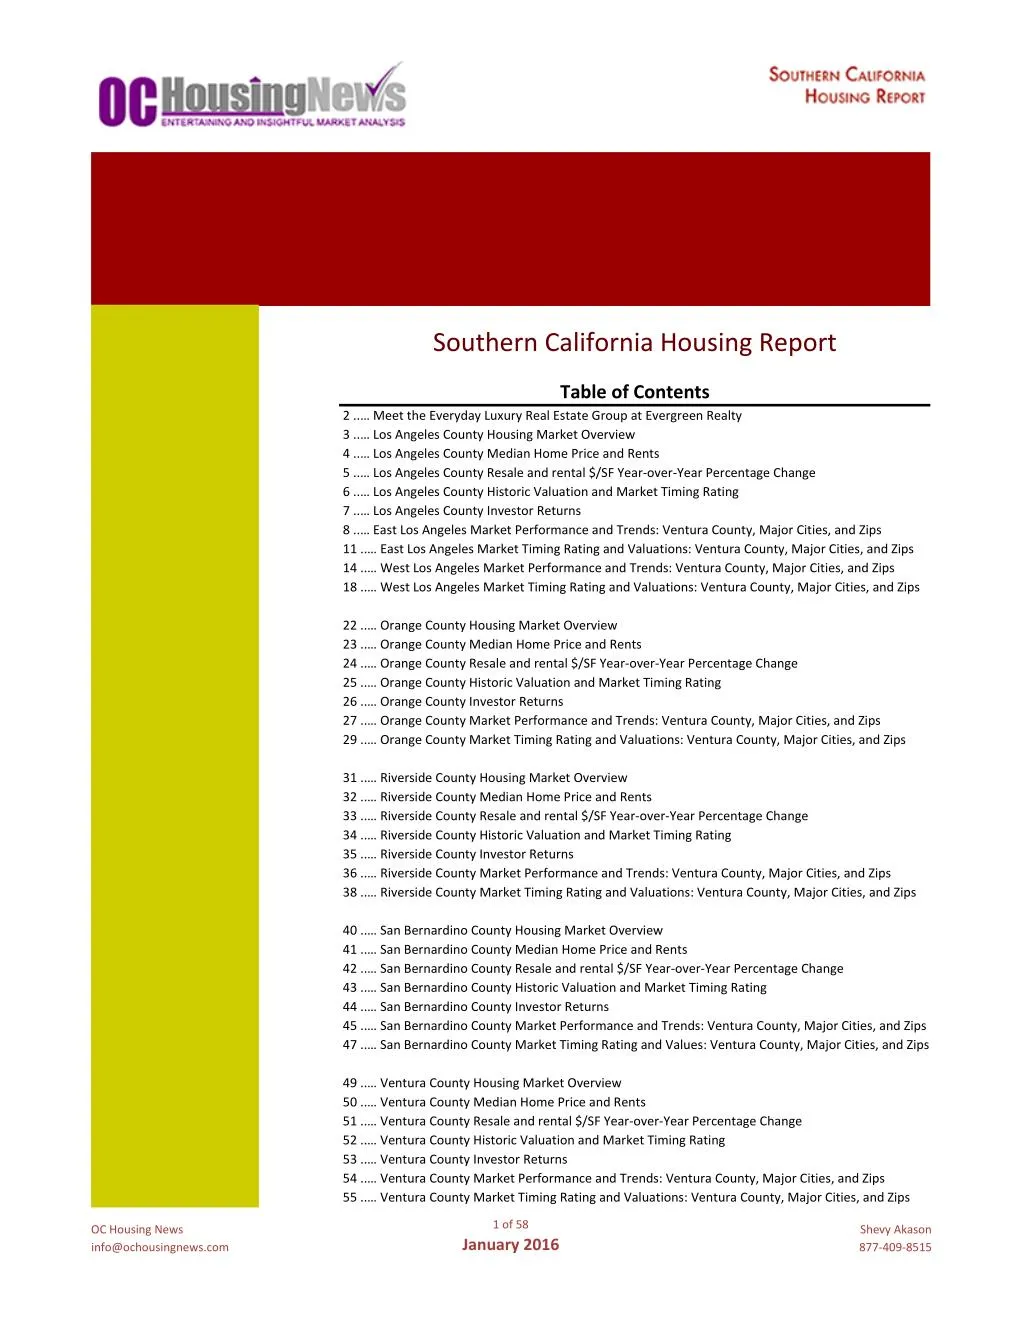
Southern California Housing Report Table of Contents 2 ..… Meet the Everyday Luxury Real Estate Group at Evergreen Realty 3 ..… Los Angeles County Housing Market Overview 4 ..… Los Angeles County Median Home Price and Rents 5 ..… Los Angeles County Resale and rental $/SF Year-over-Year Percentage Change 6 ..… Los Angeles County Historic Valuation and Market Timing Rating 7 ..… Los Angeles County Investor Returns 8 ..… East Los Angeles Market Performance and Trends: Ventura County, Major Cities, and Zips 11 ..… East Los Angeles Market Timing Rating and Valuations: Ventura County, Major Cities, and Zips 14 ..… West Los Angeles Market Performance and Trends: Ventura County, Major Cities, and Zips 18 ..… West Los Angeles Market Timing Rating and Valuations: Ventura County, Major Cities, and Zips 22 ..… Orange County Housing Market Overview 23 ..… Orange County Median Home Price and Rents 24 ..… Orange County Resale and rental $/SF Year-over-Year Percentage Change 25 ..… Orange County Historic Valuation and Market Timing Rating 26 ..… Orange County Investor Returns 27 ..… Orange County Market Performance and Trends: Ventura County, Major Cities, and Zips 29 ..… Orange County Market Timing Rating and Valuations: Ventura County, Major Cities, and Zips 31 ..… Riverside County Housing Market Overview 32 ..… Riverside County Median Home Price and Rents 33 ..… Riverside County Resale and rental $/SF Year-over-Year Percentage Change 34 ..… Riverside County Historic Valuation and Market Timing Rating 35 ..… Riverside County Investor Returns 36 ..… Riverside County Market Performance and Trends: Ventura County, Major Cities, and Zips 38 ..… Riverside County Market Timing Rating and Valuations: Ventura County, Major Cities, and Zips 40 ..… San Bernardino County Housing Market Overview 41 ..… San Bernardino County Median Home Price and Rents 42 ..… San Bernardino County Resale and rental $/SF Year-over-Year Percentage Change 43 ..… San Bernardino County Historic Valuation and Market Timing Rating 44 ..… San Bernardino County Investor Returns 45 ..… San Bernardino County Market Performance and Trends: Ventura County, Major Cities, and Zips 47 ..… San Bernardino County Market Timing Rating and Values: Ventura County, Major Cities, and Zips 49 ..… Ventura County Housing Market Overview 50 ..… Ventura County Median Home Price and Rents 51 ..… Ventura County Resale and rental $/SF Year-over-Year Percentage Change 52 ..… Ventura County Historic Valuation and Market Timing Rating 53 ..… Ventura County Investor Returns 54 ..… Ventura County Market Performance and Trends: Ventura County, Major Cities, and Zips 55 ..… Ventura County Market Timing Rating and Valuations: Ventura County, Major Cities, and Zips 1 of 58 OC Housing News info@ochousingnews.com Shevy Akason 877-409-8515 January 2016
2 of 58 OC Housing News info@ochousingnews.com Shevy Akason 877-409-8515 January 2016
Los Angeles County Housing Market News Historically, properties in this market sell at a 9.5% discount. Today's discount is 14.2%. This market is 4.7% undervalued. Median home price is $507,300 with a rental parity value of $589,300. This market's discount is $82,000. Monthly payment affordability has been improving over the last 3 month(s). Momentum suggests improving affordability. Resale prices on a $/SF basis increased from $407/SF to $409/SF. Resale prices have been rising for 10 month(s). Over the last 12 months, resale prices rose 5.4% indicating a longer term upward price trend. Median rental rates increased $8 last month from $2,633 to $2,641. The current capitalization rate (rent/price) is 5.0%. Rents have been rising for 12 month(s). Price momentum signals rising rents over the next three months. Market rating = 7 Median Home Price and Rental Parity trailing twelve months Date Rating Median Rental Parity Historic Value 1/2015 7 469,300 $ 569,000 $ 2/2015 7 467,600 $ 570,000 $ 3/2015 8 470,100 $ 567,700 $ 4/2015 8 475,100 $ 578,200 $ 5/2015 7 484,300 $ 571,900 $ 6/2015 7 492,600 $ 566,200 $ 7/2015 8 501,000 $ 567,000 $ 8/2015 8 505,100 $ 581,300 $ 9/2015 8 508,100 $ 588,300 $ 10/2015 7 508,000 $ 599,000 $ 11/2015 7 508,800 $ 588,900 $ 12/2015 7 507,300 $ 589,300 $ $800,000 514,855 $ 515,759 $ 513,678 $ 523,179 $ 517,479 $ 512,321 $ 513,045 $ 525,984 $ 532,318 $ 542,000 $ 532,861 $ 533,223 $ $600,000 $400,000 $200,000 Median Rental Parity Historic Value $- 1/2015 2/2015 3/2015 4/2015 5/2015 6/2015 7/2015 8/2015 9/2015 10/2015 11/2015 12/2015 Resale $/SF and year-over-year percentage change trailing twelve months Date ± Typ. Value $/SF % Change 1/2015 -6.2% 388 $ 8.7% 2/2015 -7.5% 382 $ 7.1% 3/2015 -8.0% 383 $ 7.1% 4/2015 -8.1% 387 $ 7.6% 5/2015 -7.3% 391 $ 7.6% 6/2015 -5.9% 395 $ 7.6% 7/2015 -3.8% 398 $ 6.6% 8/2015 -3.1% 400 $ 4.8% 9/2015 -3.3% 403 $ 4.4% 10/2015 -4.5% 406 $ 4.8% 11/2015 -4.6% 407 $ 4.9% 12/2015 -4.7% 409 $ 5.4% $415 $406 $407 $409 $410 $395 $398 $400 $403 $405 $400 $391 $395 $388 $387 $390 $382 $383 $385 $380 $375 $370 1/2015 2/2015 3/2015 4/2015 5/2015 6/2015 7/2015 8/2015 9/2015 10/2015 11/2015 12/2015 -0.0951588 Rental rate and year-over-year percentage change trailing twelve months Date % Change Rent Own Historic Cost to Own Relative to Rent 1/2015 5.3% 2,474 $ 2,087 $ $ 2/2015 5.5% 2,478 $ 2,054 $ $ 3/2015 6.0% 2,487 $ 2,044 $ $ 4/2015 6.2% 2,502 $ 2,049 $ $ 5/2015 6.7% 2,527 $ 2,085 $ $ 6/2015 6.8% 2,544 $ 2,136 $ $ 7/2015 6.9% 2,569 $ 2,208 $ $ 8/2015 6.9% 2,590 $ 2,245 $ $ 9/2015 6.9% 2,615 $ 2,260 $ $ 10/2015 7.0% 2,633 $ 2,247 $ $ 11/2015 7.2% 2,633 $ 2,255 $ $ 12/2015 7.4% 2,642 $ 2,261 $ $ $2,478 $2,569 $2,590 $2,615 $2,474 $2,487 $2,502 $2,527 $2,544 $2,633 $2,633 $2,642 $2,800 2,239 2,242 2,250 2,264 2,286 2,302 2,325 2,344 2,366 2,383 2,383 2,390 $2,600 $2,400 $2,200 $2,000 Rent Own Historic Cost to Own Relagve to Rent $1,800 1/2015 2/2015 3/2015 4/2015 5/2015 6/2015 7/2015 8/2015 9/2015 10/2015 11/2015 12/2015 3 of 58 OC Housing News info@ochousingnews.com Shevy Akason 877-409-8515 January 2016
Los Angeles County median home price since January 1988 $700,000 Median Resale Rental Parity Historic Value Projecgon $600,000 $500,000 $400,000 $300,000 $200,000 $100,000 $0 1/1988 1/1989 1/1990 1/1991 1/1992 1/1993 1/1995 1/1996 1/1998 1/1999 1/2000 1/2001 1/2002 1/2003 1/2005 1/2006 1/2008 1/2009 1/2010 1/2011 1/2012 1/2013 1/2015 1/2016 1/1994 1/1997 1/2004 1/2007 1/2014 1/2017 Los Angeles County median rent and monthly cost of ownership since January 1988 Median Rent Cost to Own Historic Cost to Own Relagve to Rent $3,500 $3,000 $2,500 $2,000 $1,500 $1,000 $500 $0 1/1988 1/1989 1/1990 1/1991 1/1992 1/1993 1/1995 1/1996 1/1998 1/1999 1/2000 1/2001 1/2002 1/2003 1/2005 1/2006 1/2008 1/2009 1/2010 1/2011 1/2012 1/2013 1/2015 1/2016 1/1994 1/1997 1/2004 1/2007 1/2014 1/2017 4 of 58 OC Housing News info@ochousingnews.com Shevy Akason 877-409-8515 January 2016
Resale $/SF Year-over-Year Percentage Change: Los Angeles County since January 1989Resale $/SF Year-over-Year Percentage Change: Los Angeles County since January 1989 50% 45% Appreciagon rates in excess of 7% are not sustainable. Long periods of excessive appreciagon lead to a crash. 40% 35% 30% 25% 20% 15% 10% 5% Normal and sustainable 0% -5% -10% -15% Falling/Correcgng -20% -25% -30% -35% -40% -45% -50% 1/1989 1/1990 1/1995 1/1996 1/1998 1/1999 1/2000 1/2005 1/2006 1/2008 1/2009 1/2010 1/2015 1/2016 1/1991 1/1992 1/1993 1/1994 1/1997 1/2001 1/2002 1/2003 1/2004 1/2007 1/2011 1/2012 1/2013 1/2014 1/2017 Rental $/SF Year-over-Year Percentage Change: Los Angeles County since January 1989 18% 16% Rental rates in excess of 7% are not sustainable. Long periods of excessive appreciagon lead to a crash. 14% 12% 10% 8% Normal and sustainable 6% 4% 2% Weak 0% -2% Falling/Correcgng -4% -6% -8% 1/1989 1/1990 1/1991 1/1992 1/1993 1/1994 1/1995 1/1996 1/1997 1/1998 1/1999 1/2000 1/2001 1/2002 1/2003 1/2004 1/2005 1/2006 1/2007 1/2008 1/2009 1/2010 1/2011 1/2012 1/2013 1/2014 1/2015 1/2016 1/2017 5 of 58 OC Housing News info@ochousingnews.com Shevy Akason 877-409-8515 January 2016
Historic Median Home Price Relative to Rental Parity: Los Angeles County since January 1988Historic Median Home Price Relative to Rental Parity: Los Angeles County since January 1988 Value Relagve to Rental Parity Historic Norm 91.0% 84.0% Stable period between housing bubbles from 1993-1999 establishes historic norm. 77.0% 70.0% 63.0% 56.0% 49.0% Discount or Premium 42.0% 35.0% 28.0% 21.0% 14.0% 7.0% 0.0% -7.0% -14.0% -21.0% -28.0% -35.0% -42.0% -49.0% 1/1988 1/1989 1/1990 1/1991 1/1992 1/1993 1/1995 1/1996 1/1998 1/1999 1/2000 1/2001 1/2002 1/2003 1/2005 1/2006 1/2008 1/2009 1/2010 1/2011 1/2012 1/2013 1/2015 1/2016 1/1994 1/1997 1/2004 1/2007 1/2014 1/2017 OCHN Market Timing System Rating: Los Angeles County since January 1988 10 9 Values 7-10: Undervalued Market: Strong Buy Recommendagon 8 7 6 Values 4-6: Neutral Market, Weak Buy Recommendagon 5 4 3 Values 1-3: Inflated or Weak Market: Consider Selling. Do not Buy. 2 1 0 1/1988 1/1989 1/1990 1/1991 1/1992 1/1993 1/1995 1/1996 1/1998 1/1999 1/2000 1/2001 1/2002 1/2003 1/2005 1/2006 1/2008 1/2009 1/2010 1/2011 1/2012 1/2013 1/2015 1/2016 1/1994 1/1997 1/2004 1/2007 1/2014 1/2017 6 of 58 OC Housing News info@ochousingnews.com Shevy Akason 877-409-8515 January 2016
Cash Investor Capitalization Rate: Los Angeles County since January 1988Cash Investor Capitalization Rate: Los Angeles County since January 1988 Capitalizagon Rate Mortgage Interest Rate 12.0% 10.0% 8.0% 6.0% 4.0% 2.0% 0.0% 1/1988 1/1989 1/1990 1/1991 1/1992 1/1993 1/1995 1/1996 1/1998 1/1999 1/2000 1/2001 1/2002 1/2003 1/2005 1/2006 1/2008 1/2009 1/2010 1/2011 1/2012 1/2013 1/2015 1/2016 1/1994 1/1997 1/2004 1/2007 1/2014 1/2017 Financed Investor Cash-on-Cash Return: Los Angeles County since January 1988 25.0% 20.0% 15.0% 10.0% 5.0% 0.0% -5.0% -10.0% -15.0% -20.0% -25.0% -30.0% 1/1988 1/1989 1/1990 1/1991 1/1992 1/1993 1/1995 1/1996 1/1998 1/1999 1/2000 1/2001 1/2002 1/2003 1/2005 1/2006 1/2008 1/2009 1/2010 1/2011 1/2012 1/2013 1/2015 1/2016 1/1994 1/1997 1/2004 1/2007 1/2014 1/2017 7 of 58 OC Housing News info@ochousingnews.com Shevy Akason 877-409-8515 January 2016
Market Performance and Trends: East Los Angeles County, Major Cities, and ZipsMarket Performance and Trends: East Los Angeles County, Major Cities, and Zips Median Resale $ Resale % Change YoY Resale $/SF Change YoY Rent % Median Rent $ Cost of Ownership Ownership Prem./Disc. Cap Rate City Alhambra 533,600 $ 3.7% $ 392 10.8% $ 2,098 $ 2,372 $ 274 3.8% 941,700 $ Arcadia -14.5% $ 507 4.3% $ 2,803 $ 4,204 $ 1,401 2.9% 392,400 $ Artesia 15.3% $ 377 0.6% $ 1,717 $ 1,757 $ 40 4.2% 372,700 $ Azusa 1.7% $ 286 3.0% $ 1,887 $ 1,644 $ (243) 4.9% 347,500 $ Baldwin Park 8.5% $ 300 10.3% $ 1,746 $ 1,553 $ (193) 4.8% 420,500 $ Bellflower 14.5% $ 326 3.9% $ 1,925 $ 1,840 $ (85) 4.4% 419,800 $ Canyon Country 10.1% $ 255 7.9% $ 2,174 $ 1,863 $ (311) 5.0% 629,800 $ Cerritos 8.1% $ 375 5.9% $ 2,564 $ 2,799 $ 235 3.9% 579,100 $ Claremont 0.7% $ 307 4.4% $ 2,225 $ 2,595 $ 370 3.7% 430,100 $ Covina 8.2% $ 302 8.8% $ 2,001 $ 1,906 $ (95) 4.5% 533,400 $ Diamond Bar 3.2% $ 336 4.2% $ 2,403 $ 2,378 $ (24) 4.3% 472,500 $ Downey 14.3% $ 347 12.0% $ 1,921 $ 2,117 $ 196 3.9% 413,900 $ Duarte 9.6% $ 343 9.0% $ 1,994 $ 1,802 $ (192) 4.6% 412,400 $ El Monte 2.6% $ 304 17.0% $ 1,811 $ 1,842 $ 31 4.2% 528,100 $ Glendora 5.0% $ 341 5.6% $ 2,275 $ 2,341 $ 66 4.1% 545,000 $ Hacienda Heights 2.7% $ 312 1.4% $ 2,272 $ 2,417 $ 145 4.0% 488,500 $ La Mirada 4.8% $ 328 4.5% $ 2,442 $ 2,163 $ (279) 4.8% 380,100 $ La Puente 9.9% $ 307 5.8% $ 1,933 $ 1,681 $ (252) 4.9% 561,900 $ La Verne 6.7% $ 327 3.1% $ 2,326 $ 2,565 $ 239 4.0% 491,300 $ Lakewood 8.4% $ 379 4.6% $ 2,249 $ 2,177 $ (72) 4.4% 208,200 $ Lancaster 11.0% $ 122 0.0% $ 1,474 $ 909 $ (565) 6.8% 548,000 $ Monrovia 1.1% $ 399 5.8% $ 2,306 $ 2,451 $ 146 4.0% 539,800 $ Monterey Park 4.0% $ 368 5.3% $ 2,257 $ 2,356 $ 98 4.0% 354,300 $ Newhall 7.4% $ 254 8.6% $ 1,683 $ 1,591 $ (91) 4.6% 391,500 $ Norwalk 14.1% $ 343 4.5% $ 1,965 $ 1,741 $ (224) 4.8% 249,700 $ Palmdale 14.8% $ 140 8.7% $ 1,535 $ 1,100 $ (435) 5.9% 668,700 $ Pasadena -0.7% $ 484 3.4% $ 2,389 $ 2,968 $ 579 3.4% 327,200 $ Pomona 7.6% $ 250 3.4% $ 1,644 $ 1,452 $ (192) 4.8% 565,100 $ Rowland Heights 4.3% $ 342 2.5% $ 2,259 $ 2,522 $ 263 3.8% 500,200 $ San Dimas 7.4% $ 318 6.6% $ 2,000 $ 2,175 $ 175 3.8% 660,200 $ San Gabriel -2.1% $ 419 0.0% $ 2,322 $ 2,939 $ 616 3.4% 2,223,800 $ San Marino -12.0% $ 820 1.9% $ 3,572 $ 9,915 $ 6,342 1.5% 836,400 $ Sierra Madre 3.8% $ 489 -6.5% $ 2,364 $ 3,718 $ 1,354 2.7% 1,045,700 $ South Pasadena -2.5% $ 553 5.2% $ 2,607 $ 4,614 $ 2,007 2.4% 623,000 $ Stevenson Ranch 2.5% $ 265 -5.8% $ 2,326 $ 2,746 $ 419 3.6% 441,900 $ Sunland 13.1% $ 342 32.1% $ 1,965 $ 1,988 $ 22 4.3% 8 of 58 OC Housing News info@ochousingnews.com Shevy Akason 877-409-8515 January 2016
Market Performance and Trends: East Los Angeles County, Major Cities, and ZipsMarket Performance and Trends: East Los Angeles County, Major Cities, and Zips Median Resale $ Resale % Change YoY Resale $/SF Change YoY Rent % Median Rent $ Cost of Ownership Ownership Prem./Disc. Cap Rate City Temple City 653,700 $ -3.4% $ 430 6.4% $ 2,139 $ 2,950 $ 811 3.1% 468,600 $ Tujunga 20.6% $ 368 -1.3% $ 2,127 $ 2,075 $ (51) 4.4% 439,200 $ Van Nuys 5.5% $ 303 8.5% $ 1,966 $ 1,934 $ (32) 4.3% 460,600 $ West Covina 6.9% $ 311 2.6% $ 2,042 $ 2,038 $ (3) 4.3% 448,200 $ Whittier 7.8% $ 329 1.9% $ 2,008 $ 1,990 $ (18) 4.3% 652,500 $ Woodland Hills 4.6% $ 360 6.3% $ 2,554 $ 2,892 $ 338 3.8% 531,300 $ Alhambra 91801 4.7% $ 399 12.2% $ 1,962 $ 2,361 $ 399 3.5% 535,200 $ Alhambra 91803 4.8% $ 389 5.7% $ 1,885 $ 2,387 $ 502 3.4% 928,000 $ Arcadia 91006 -7.5% $ 518 4.0% $ 2,817 $ 4,134 $ 1,317 2.9% 372,700 $ Azusa 91702 1.7% $ 286 3.0% $ 1,887 $ 1,644 $ (243) 4.9% 395,400 $ Canyon Country 91351 9.2% $ 258 8.9% $ 1,744 $ 1,756 $ 13 4.2% 461,100 $ Canyon Country 91387 9.1% $ 250 3.5% $ 2,437 $ 2,016 $ (420) 5.1% 399,700 $ Covina 91722 5.8% $ 306 0.4% $ 2,121 $ 1,778 $ (343) 5.1% 425,500 $ Covina 91723 9.9% $ 309 18.1% $ 1,729 $ 1,884 $ 155 3.9% 540,500 $ Diamond Bar 91765 2.5% $ 331 5.0% $ 2,411 $ 2,394 $ (17) 4.3% 413,900 $ Duarte 91010 9.9% $ 344 8.5% $ 1,994 $ 1,798 $ (197) 4.6% 392,800 $ El Monte 91732 5.7% $ 302 8.5% $ 1,742 $ 1,779 $ 37 4.3% 454,700 $ Glendora 91740 6.0% $ 331 6.9% $ 2,325 $ 2,022 $ (303) 4.9% 635,400 $ Glendora 91741 4.7% $ 352 4.6% $ 2,367 $ 2,831 $ 463 3.6% 552,500 $ Hacienda Hts 91745 2.9% $ 313 -0.7% $ 2,322 $ 2,455 $ 133 4.0% 377,300 $ La Puente 91744 10.6% $ 307 5.2% $ 1,864 $ 1,669 $ (195) 4.7% 567,500 $ La Verne 91750 5.7% $ 324 3.1% $ 2,326 $ 2,585 $ 260 3.9% 507,600 $ Lakewood 90713 8.8% $ 390 -0.3% $ 2,211 $ 2,247 $ 35 4.2% 412,300 $ Lakewood 90715 11.9% $ 341 14.9% $ 1,804 $ 1,807 $ 3 4.2% 548,000 $ Monrovia 91016 1.1% $ 399 5.8% $ 2,306 $ 2,451 $ 146 4.0% 544,600 $ Monterey Park 91754 6.2% $ 383 5.6% $ 2,207 $ 2,367 $ 160 3.9% 478,200 $ Monterey Park 91755 1.4% $ 346 -0.2% $ 2,356 $ 2,132 $ (224) 4.7% 343,500 $ Newhall 91321 7.3% $ 254 8.3% $ 1,683 $ 1,547 $ (135) 4.7% 391,500 $ Norwalk 90650 14.1% $ 343 4.5% $ 1,965 $ 1,741 $ (224) 4.8% 493,500 $ Pasadena 91101 0.7% $ 481 4.3% $ 2,514 $ 2,210 $ (305) 4.9% 604,300 $ Pasadena 91103 26.7% $ 492 10.5% $ 2,392 $ 2,620 $ 228 3.8% 662,500 $ Pasadena 91104 11.3% $ 479 13.0% $ 2,226 $ 2,985 $ 759 3.2% 1,127,600 $ Pasadena 91105 -2.4% $ 548 14.7% $ 3,402 $ 5,172 $ 1,771 2.9% 555,900 $ Pasadena 91106 10.7% $ 483 4.6% $ 2,411 $ 2,435 $ 23 4.2% 699,200 $ Pasadena 91107 -5.0% $ 455 0.7% $ 2,562 $ 3,134 $ 573 3.5% 570,200 $ Playa del Rey 90293 14.0% $ 555 5.5% $ 2,898 $ 2,503 $ (394) 4.9% 340,700 $ Pomona 91767 7.3% $ 248 3.9% $ 1,808 $ 1,505 $ (303) 5.1% 9 of 58 OC Housing News info@ochousingnews.com Shevy Akason 877-409-8515 January 2016
Market Performance and Trends: East Los Angeles County, Major Cities, and ZipsMarket Performance and Trends: East Los Angeles County, Major Cities, and Zips Median Resale $ Resale % Change YoY Resale $/SF Change YoY Rent % Median Rent $ Cost of Ownership Ownership Prem./Disc. Cap Rate City Pomona 91767 340,700 $ 7.3% $ 248 3.9% $ 1,808 $ 1,505 $ (303) 5.1% 324,200 $ Pomona 91768 8.6% $ 248 9.7% $ 1,535 $ 1,433 $ (102) 4.5% 506,200 $ Rosemead 91770 5.0% $ 374 3.3% $ 1,923 $ 2,220 $ 297 3.6% 565,100 $ Rowland Heights 91748 4.2% $ 342 2.6% $ 2,259 $ 2,522 $ 263 3.8% 500,200 $ San Dimas 91773 7.3% $ 318 6.5% $ 2,000 $ 2,175 $ 175 3.8% 757,400 $ San Gabriel 91775 1.2% $ 451 -6.8% $ 2,322 $ 3,334 $ 1,012 2.9% 548,900 $ San Gabriel 91776 -8.6% $ 379 12.7% $ 1,943 $ 2,409 $ 466 3.4% 2,223,800 $ San Marino 91108 -12.0% $ 820 1.8% $ 3,572 $ 9,915 $ 6,342 1.5% 870,400 $ Sierra Madre 91024 3.8% $ 489 -6.7% $ 2,364 $ 3,849 $ 1,485 2.6% 1,045,700 $ South Pasadena 91030 -2.4% $ 554 5.2% $ 2,607 $ 4,614 $ 2,007 2.4% 623,000 $ Stevenson Ranch 91381 2.5% $ 265 -5.8% $ 2,326 $ 2,746 $ 419 3.6% 441,900 $ Sunland 91040 13.1% $ 342 32.1% $ 1,965 $ 1,988 $ 22 4.3% 648,500 $ Temple City 91780 -3.4% $ 430 6.5% $ 2,139 $ 2,936 $ 797 3.2% 468,600 $ Tujunga 91042 20.7% $ 368 0.0% $ 2,359 $ 2,075 $ (284) 4.8% 452,500 $ West Covina 91790 7.8% $ 321 3.4% $ 2,177 $ 1,996 $ (182) 4.6% 488,100 $ West Covina 91791 3.9% $ 307 1.0% $ 2,108 $ 2,153 $ 45 4.1% 422,000 $ West Covina 91792 7.0% $ 296 5.2% $ 1,943 $ 1,899 $ (44) 4.4% 504,700 $ Whittier 90603 6.1% $ 335 1.2% $ 2,499 $ 2,235 $ (264) 4.8% 439,000 $ Whittier 90605 8.6% $ 337 8.3% $ 1,959 $ 1,950 $ (10) 4.3% 751,500 $ Woodland Hills 91364 3.0% $ 363 4.9% $ 3,045 $ 3,318 $ 273 3.9% 10 of 58 OC Housing News info@ochousingnews.com Shevy Akason 877-409-8515 January 2016
Market Timing Rating and Valuations: East Los Angeles County, Major Cities, and ZipsMarket Timing Rating and Valuations: East Los Angeles County, Major Cities, and Zips % Over/Under Historic Premium % Over/Under Historic Prem. Median Rental Parity Rental Parity Rating City Alhambra $ 533,600 468,100 $ 8 26.6% 12.0% -14.5% $ 941,700 625,300 $ Arcadia 5 56.3% 50.7% -5.6% $ 392,400 383,000 $ Artesia 6 12.9% -1.3% -14.1% $ 372,700 421,000 $ Azusa 7 1.8% -11.7% -13.5% $ 347,500 389,600 $ Baldwin Park 7 4.2% -9.8% -14.0% $ 420,500 429,400 $ Bellflower 10 23.0% -3.5% -26.5% $ 419,800 484,900 $ Canyon Country 8 8.8% -12.4% -21.2% $ 629,800 572,000 $ Cerritos 8 21.4% 9.8% -11.6% $ 579,100 496,300 $ Claremont 6 19.1% 14.2% -4.9% $ 430,100 446,400 $ Covina 7 9.8% -4.3% -14.1% $ 533,400 536,000 $ Diamond Bar 10 25.6% -0.8% -26.4% $ 472,500 428,600 $ Downey 6 7.2% 11.0% 3.8% $ 413,900 444,900 $ Duarte 7 2.5% -10.4% -12.9% $ 412,400 404,000 $ El Monte 7 3.6% -1.2% -4.8% $ 528,100 507,500 $ Glendora 9 20.6% 5.4% -15.2% $ 545,000 506,900 $ Hacienda Heights 7 21.0% 7.3% -13.6% $ 488,500 544,700 $ La Mirada 9 -0.5% -11.8% -11.3% $ 380,100 431,300 $ La Puente 9 4.2% -12.0% -16.3% $ 561,900 518,800 $ La Verne 10 33.8% 10.4% -23.4% $ 491,300 501,600 $ Lakewood 8 12.2% -3.1% -15.3% $ 208,200 328,800 $ Lancaster 6 -14.0% -37.8% -23.8% $ 548,000 514,300 $ Monrovia 7 18.9% 10.1% -8.9% $ 539,800 503,600 $ Monterey Park 10 29.7% 7.1% -22.6% $ 354,300 375,300 $ Newhall 9 23.1% -3.1% -26.2% $ 391,500 438,400 $ Norwalk 8 0.4% -12.1% -12.5% $ 249,700 342,400 $ Palmdale 7 -15.2% -26.9% -11.7% $ 668,700 532,900 $ Pasadena 6 17.1% 22.1% 5.1% $ 327,200 366,700 $ Pomona 8 -4.6% -13.9% -9.3% $ 565,100 503,900 $ Rowland Heights 8 13.5% 8.1% -5.4% $ 500,200 446,200 $ San Dimas 9 24.5% 7.4% -17.2% $ 660,200 518,000 $ San Gabriel 4 32.5% 28.2% -4.3% 2,223,800 $ 796,900 $ San Marino 1 100.0% 170.8% 70.8% $ 836,400 527,300 $ Sierra Madre 4 53.2% 59.0% 5.8% 1,045,700 $ 581,600 $ South Pasadena 4 56.6% 77.3% 20.7% $ 623,000 519,000 $ Stevenson Ranch 4 14.6% 15.8% 1.2% $ 441,900 438,400 $ Sunland 6 4.1% -0.4% -4.4% 11 of 58 OC Housing News info@ochousingnews.com Shevy Akason 877-409-8515 January 2016
Market Timing Rating and Valuations: East Los Angeles County, Major Cities, and ZipsMarket Timing Rating and Valuations: East Los Angeles County, Major Cities, and Zips % Over/Under Historic Premium % Over/Under Historic Prem. Median Rental Parity Rental Parity Rating City $ 653,700 477,100 $ Temple City 6 40.6% 36.9% -3.7% $ 468,600 474,400 $ Tujunga 4 -6.7% -2.4% 4.4% $ 439,200 438,700 $ Van Nuys 8 5.5% -3.1% -8.6% $ 460,600 455,500 $ West Covina 9 12.4% -1.3% -13.7% $ 448,200 448,000 $ Whittier 6 10.1% -0.1% 12.7% -10.2% -7.6% $ 652,500 569,700 $ Woodland Hills 8 20.2% $ 531,300 437,600 $ Alhambra 91801 8 31.1% 18.6% -12.5% $ 535,200 420,400 $ Alhambra 91803 8 20.3% 25.2% 4.9% $ 928,000 628,400 $ Arcadia 91006 6 56.9% 47.1% -9.9% $ 372,700 421,000 $ Azusa 91702 7 1.8% -11.7% -13.5% $ 395,400 389,000 $ Canyon Country 91351 7 9.7% -2.6% -12.3% $ 461,100 543,600 $ Canyon Country 91387 10 31.7% -17.9% -49.5% $ 399,700 473,200 $ Covina 91722 9 10.5% -14.9% -25.3% $ 425,500 385,600 $ Covina 91723 6 11.1% 7.2% -3.9% $ 540,500 537,900 $ Diamond Bar 91765 10 26.9% -0.5% -27.4% $ 413,900 444,900 $ Duarte 91010 7 2.5% -10.7% -13.2% $ 392,800 388,500 $ El Monte 91732 7 5.5% -0.7% -6.3% $ 454,700 518,700 $ Glendora 91740 10 10.9% -10.2% -21.1% $ 635,400 528,100 $ Glendora 91741 10 43.2% 21.5% -21.7% $ 552,500 518,000 $ Hacienda Hts 91745 6 20.9% 5.8% -15.1% $ 377,300 415,800 $ La Puente 91744 8 5.0% -9.9% -14.9% $ 567,500 518,800 $ La Verne 91750 10 33.4% 11.3% -22.1% $ 507,600 493,300 $ Lakewood 90713 5 12.4% 1.8% -10.5% $ 412,300 402,400 $ Lakewood 90715 7 10.3% 1.9% -8.3% $ 548,000 514,300 $ Monrovia 91016 7 18.9% 10.1% -8.9% $ 544,600 492,300 $ Monterey Park 91754 10 30.8% 10.1% -20.7% $ 478,200 525,500 $ Monterey Park 91755 6 23.4% -8.0% -31.4% $ 343,500 375,300 $ Newhall 91321 9 23.7% -5.8% -29.5% $ 391,500 438,400 $ Norwalk 90650 8 0.4% -12.1% -12.4% $ 493,500 560,900 $ Pasadena 91101 6 -8.8% -12.2% -3.4% $ 604,300 533,600 $ Pasadena 91103 5 -5.2% 8.0% 13.2% $ 662,500 496,500 $ Pasadena 91104 6 31.3% 33.5% 2.2% 1,127,600 $ 758,900 $ Pasadena 91105 6 65.5% 51.8% -13.7% $ 555,900 537,900 $ Pasadena 91106 8 15.8% 0.2% -15.6% $ 699,200 571,500 $ Pasadena 91107 5 32.5% 23.4% -9.1% $ 570,200 646,400 $ Playa del Rey 90293 10 19.5% -13.4% -32.9% 12 of 58 OC Housing News info@ochousingnews.com Shevy Akason 877-409-8515 January 2016
Market Timing Rating and Valuations: East Los Angeles County, Major Cities, and ZipsMarket Timing Rating and Valuations: East Los Angeles County, Major Cities, and Zips % Over/Under Historic Premium % Over/Under Historic Prem. Median Rental Parity Rental Parity Rating City $ 340,700 403,200 $ Pomona 91767 8 -6.7% -16.4% -9.6% $ 324,200 342,400 $ Pomona 91768 6 -8.1% -5.7% 2.4% $ 506,200 428,900 $ Rosemead 91770 9 29.3% 14.0% -15.3% $ 565,100 503,900 $ Rowland Heights 91748 8 14.0% 8.1% -5.9% $ 500,200 446,200 $ San Dimas 91773 9 24.5% 7.4% -17.2% $ 757,400 518,000 $ San Gabriel 91775 2 43.4% 42.0% -1.4% $ 548,900 433,500 $ San Gabriel 91776 5 37.3% 24.0% -13.4% 2,223,800 $ 796,900 $ San Marino 91108 1 99.5% 170.8% 71.3% $ 870,400 527,300 $ Sierra Madre 91024 3 53.2% 64.6% 11.3% 1,045,700 $ 581,600 $ South Pasadena 91030 4 56.6% 77.3% 20.7% $ 623,000 519,000 $ Stevenson Ranch 91381 4 23.4% 15.8% -7.5% $ 441,900 438,400 $ Sunland 91040 6 3.1% -0.4% -3.5% $ 648,500 477,100 $ Temple City 91780 6 40.8% 36.3% -4.5% $ 468,600 526,200 $ Tujunga 91042 6 -0.5% -11.7% -11.2% $ 452,500 485,700 $ West Covina 91790 9 14.4% -7.3% -21.8% $ 488,100 470,300 $ West Covina 91791 7 13.9% 0.5% -13.3% $ 422,000 433,400 $ West Covina 91792 8 12.6% -0.3% -12.9% $ 504,700 557,600 $ Whittier 90603 9 20.4% -9.6% -30.0% $ 439,000 437,100 $ Whittier 90605 7 15.9% 2.3% -13.7% $ 751,500 679,400 $ Woodland Hills 91364 9 15.7% 7.0% -8.7% 13 of 58 OC Housing News info@ochousingnews.com Shevy Akason 877-409-8515 January 2016
Market Performance and Trends: West Los Angeles County, Major Cities, and ZipsMarket Performance and Trends: West Los Angeles County, Major Cities, and Zips Median Resale $ Resale % Change YoY Resale $/SF Change YoY Rent % Median Rent $ Cost of Ownership Ownership Prem./Disc. Cap Rate City Agoura Hills 687,600 $ 9.2% $ 349 4.4% $ 2,788 $ 3,026 $ 239 3.9% 672,700 $ Altadena 12.3% $ 446 -7.7% $ 2,467 $ 3,019 $ 552 3.5% 2,211,100 $ Beverly Hills 7.8% $ 954 7.8% $ 3,963 $ 9,684 $ 5,721 1.7% 642,600 $ Burbank 4.2% $ 444 10.9% $ 2,692 $ 2,849 $ 157 4.0% 1,035,900 $ Calabasas 5.8% $ 412 1.7% $ 3,268 $ 4,599 $ 1,331 3.0% 368,400 $ Canoga Park 12.5% $ 298 0.1% $ 1,792 $ 1,656 $ (136) 4.7% 413,100 $ Carson 8.8% $ 300 10.5% $ 2,257 $ 1,850 $ (407) 5.2% 483,900 $ Chatsworth 0.7% $ 271 9.7% $ 2,460 $ 2,235 $ (225) 4.9% 739,300 $ Culver City 17.4% $ 578 3.1% $ 3,177 $ 3,277 $ 100 4.1% 689,600 $ Encino 2.0% $ 401 7.2% $ 2,747 $ 3,108 $ 361 3.8% 418,300 $ Gardena 9.6% $ 322 7.2% $ 2,243 $ 1,855 $ (388) 5.1% 631,300 $ Glendale 9.4% $ 423 3.4% $ 2,262 $ 2,842 $ 580 3.4% 534,300 $ Granada Hills 9.2% $ 319 6.6% $ 2,476 $ 2,389 $ (86) 4.4% 485,900 $ Harbor City 8.3% $ 319 1.7% $ 2,375 $ 2,107 $ (267) 4.7% 485,000 $ Hawthorne 5.5% $ 392 4.9% $ 2,939 $ 2,182 $ (757) 5.8% 1,394,100 $ Hermosa Beach 11.2% $ 934 11.1% $ 3,766 $ 6,119 $ 2,353 2.6% 368,200 $ Inglewood 20.2% $ 291 1.6% $ 1,694 $ 1,637 $ (56) 4.4% 1,564,100 $ La Canada Flintridge 12.8% $ 632 -1.9% $ 3,577 $ 6,829 $ 3,252 2.2% 728,300 $ La Crescenta 9.4% $ 458 13.1% $ 3,212 $ 3,237 $ 24 4.2% 523,400 $ Lomita 11.0% $ 373 9.7% $ 2,203 $ 2,320 $ 117 4.0% 462,000 $ Long Beach 8.2% $ 382 9.5% $ 2,197 $ 2,048 $ (149) 4.6% 654,600 $ Los Angeles (City) 6.8% $ 512 7.8% $ 3,233 $ 2,915 $ (317) 4.7% 2,022,100 $ Malibu 1.5% $ 1,049 7.0% $ 3,960 $ 8,719 $ 4,759 1.9% 2,096,600 $ Manhattan Beach 18.0% $ 1,138 15.1% $ 3,856 $ 9,078 $ 5,223 1.8% 896,900 $ Marina del Rey 6.7% $ 604 6.2% $ 3,517 $ 3,954 $ 436 3.8% 547,800 $ Montrose 5.6% $ 406 -1.7% $ 2,701 $ 2,442 $ (260) 4.7% 433,400 $ North Hills 10.6% $ 267 7.7% $ 2,446 $ 1,931 $ (515) 5.4% 472,600 $ North Hollywood 11.3% $ 364 3.8% $ 2,171 $ 2,094 $ (78) 4.4% 600,500 $ Northridge 8.3% $ 304 4.4% $ 3,081 $ 2,661 $ (421) 4.9% 2,251,700 $ Pacific Palisades 4.7% $ 925 -1.2% $ 4,642 $ 10,019 $ 5,378 2.0% 570,200 $ Playa del Rey 14.0% $ 555 6.2% $ 2,898 $ 2,503 $ (394) 4.9% 1,093,200 $ Rancho Palos Verdes 5.2% $ 518 3.3% $ 3,825 $ 4,809 $ 984 3.4% 852,900 $ Redondo Beach 7.3% $ 536 3.7% $ 3,117 $ 3,819 $ 702 3.5% 428,300 $ Reseda 10.9% $ 311 2.5% $ 2,359 $ 1,900 $ (459) 5.3% 467,700 $ San Pedro 7.6% $ 354 4.5% $ 1,943 $ 2,079 $ 136 4.0% 1,196,800 $ Santa Monica 0.6% $ 940 8.2% $ 3,592 $ 5,402 $ 1,810 2.9% 735,500 $ Sherman Oaks 6.7% $ 451 3.1% $ 2,814 $ 3,221 $ 408 3.7% 14 of 58 OC Housing News info@ochousingnews.com Shevy Akason 877-409-8515 January 2016
Market Performance and Trends: West Los Angeles County, Major Cities, and ZipsMarket Performance and Trends: West Los Angeles County, Major Cities, and Zips Median Resale $ Resale % Change YoY Resale $/SF Change YoY Rent % Median Rent $ Cost of Ownership Ownership Prem./Disc. Cap Rate City Studio City 927,700 $ 5.8% $ 530 12.5% $ 3,682 $ 4,189 $ 507 3.8% 395,400 $ Sylmar 5.5% $ 268 3.1% $ 2,400 $ 1,754 $ (646) 5.8% 559,700 $ Tarzana 5.4% $ 333 9.3% $ 2,649 $ 2,503 $ (146) 4.5% 591,500 $ Torrance 2.7% $ 417 5.6% $ 2,693 $ 2,644 $ (49) 4.4% 472,500 $ Valencia 5.6% $ 288 4.2% $ 2,459 $ 2,090 $ (368) 5.0% 782,400 $ Valley Village 4.6% $ 423 11.0% $ 2,790 $ 3,489 $ 700 3.4% 1,597,700 $ Venice 8.3% $ 1,096 9.4% $ 3,958 $ 7,269 $ 3,310 2.4% 709,900 $ Walnut -1.5% $ 370 3.2% $ 2,616 $ 3,182 $ 566 3.5% 574,300 $ West Hills 10.6% $ 346 5.8% $ 2,735 $ 2,544 $ (192) 4.6% 695,600 $ West Hollywood 15.3% $ 701 4.2% $ 3,489 $ 3,067 $ (421) 4.8% 460,300 $ Winnetka 8.9% $ 293 3.3% $ 2,474 $ 2,026 $ (449) 5.2% 687,600 $ Agoura Hills 91301 9.2% $ 349 4.4% $ 2,788 $ 3,026 $ 239 3.9% 672,700 $ Altadena 91001 12.1% $ 446 -7.7% $ 2,467 $ 3,019 $ 552 3.5% 2,717,800 $ Beverly Hills 90210 6.2% $ 1,036 5.2% $ 3,913 $ 12,185 $ 8,273 1.4% 1,541,600 $ Beverly Hills 90211 0.1% $ 756 1.7% $ 4,298 $ 6,698 $ 2,400 2.7% 598,000 $ Burbank 91501 8.7% $ 433 0.6% $ 2,567 $ 2,632 $ 65 4.1% 623,700 $ Burbank 91504 3.2% $ 405 4.1% $ 2,889 $ 2,748 $ (141) 4.4% 628,000 $ Burbank 91505 4.7% $ 470 14.8% $ 2,456 $ 2,784 $ 328 3.8% 1,124,800 $ Calabasas 91302 5.0% $ 414 1.6% $ 3,356 $ 4,886 $ 1,531 2.9% 483,900 $ Chatsworth 91311 0.7% $ 271 9.7% $ 2,460 $ 2,235 $ (225) 4.9% 510,800 $ Culver City 90230 16.6% $ 531 5.2% $ 2,839 $ 2,220 $ (619) 5.3% 383,000 $ Gardena 90247 7.8% $ 299 -2.0% $ 1,600 $ 1,705 $ 105 4.0% 571,200 $ Glendale 91202 10.6% $ 401 10.7% $ 2,571 $ 2,513 $ (58) 4.3% 628,600 $ Glendale 91206 7.4% $ 389 -3.2% $ 2,246 $ 2,645 $ 399 3.4% 810,900 $ Glendale 91207 15.3% $ 452 4.6% $ 2,665 $ 3,675 $ 1,011 3.2% 829,000 $ Glendale 91208 10.8% $ 449 1.2% $ 2,635 $ 3,700 $ 1,065 3.1% 537,200 $ Granada Hills 91344 8.5% $ 318 6.6% $ 2,476 $ 2,406 $ (69) 4.4% 482,100 $ Harbor City 90710 8.2% $ 319 2.0% $ 2,383 $ 2,098 $ (285) 4.7% La Canada Flintridge 91011 1,564,100 $ 12.8% $ 632 -1.9% $ 3,577 $ 6,829 $ 3,252 2.2% 728,300 $ La Crescenta 91214 9.4% $ 458 13.1% $ 3,212 $ 3,237 $ 24 4.2% 523,400 $ Lomita 90717 11.4% $ 373 9.1% $ 2,203 $ 2,320 $ 117 4.0% 293,000 $ Long Beach 90802 9.0% $ 377 9.4% $ 2,084 $ 1,291 $ (793) 6.8% 660,700 $ Long Beach 90803 4.3% $ 502 7.5% $ 2,497 $ 3,044 $ 547 3.6% 359,700 $ Long Beach 90804 6.6% $ 358 7.6% $ 1,881 $ 1,577 $ (304) 5.0% 353,300 $ Long Beach 90805 7.4% $ 308 10.2% $ 1,933 $ 1,568 $ (365) 5.3% 353,300 $ Long Beach 90805 7.4% $ 308 10.2% $ 1,933 $ 1,568 $ (365) 5.3% 422,800 $ Long Beach 90806 15.9% $ 346 9.8% $ 1,653 $ 1,849 $ 196 3.8% 15 of 58 OC Housing News info@ochousingnews.com Shevy Akason 877-409-8515 January 2016
Market Performance and Trends: West Los Angeles County, Major Cities, and ZipsMarket Performance and Trends: West Los Angeles County, Major Cities, and Zips Median Resale $ Resale % Change YoY Resale $/SF Change YoY Rent % Median Rent $ Cost of Ownership Ownership Prem./Disc. Cap Rate City Long Beach 90807 533,500 $ 11.1% $ 369 8.3% $ 1,556 $ 2,325 $ 769 2.8% 571,900 $ Long Beach 90808 3.6% $ 398 10.0% $ 2,252 $ 2,546 $ 295 3.8% 299,800 $ Long Beach 90813 15.0% $ 300 10.3% $ 1,182 $ 1,332 $ 150 3.8% 617,400 $ Long Beach 90814 1.6% $ 419 27.3% $ 2,236 $ 2,718 $ 482 3.5% 582,300 $ Long Beach 90815 8.9% $ 406 11.2% $ 2,462 $ 2,571 $ 110 4.1% 806,300 $ Los Angeles 90004 12.1% $ 629 23.3% $ 3,448 $ 3,610 $ 162 4.1% 607,700 $ Los Angeles 90005 -2.3% $ 435 10.6% $ 2,943 $ 2,659 $ (284) 4.6% 460,800 $ Los Angeles 90012 2.5% $ 519 7.0% $ 2,294 $ 2,051 $ (243) 4.8% 877,200 $ Los Angeles 90019 9.7% $ 497 5.6% $ 2,587 $ 3,896 $ 1,309 2.8% 441,800 $ Los Angeles 90020 1.6% $ 493 9.0% $ 2,326 $ 1,946 $ (380) 5.1% 834,800 $ Los Angeles 90024 5.7% $ 678 5.7% $ 3,114 $ 3,686 $ 573 3.6% 772,100 $ Los Angeles 90025 10.5% $ 586 7.5% $ 3,721 $ 3,430 $ (291) 4.6% 826,900 $ Los Angeles 90026 8.4% $ 592 -1.7% $ 3,450 $ 3,544 $ 94 4.0% 1,205,000 $ Los Angeles 90027 2.7% $ 605 10.7% $ 3,193 $ 5,319 $ 2,126 2.5% 828,000 $ Los Angeles 90034 12.6% $ 596 32.4% $ 3,811 $ 3,763 $ (48) 4.4% 973,900 $ Los Angeles 90035 14.6% $ 625 8.3% $ 3,269 $ 4,288 $ 1,019 3.2% 1,205,200 $ Los Angeles 90036 1.9% $ 617 10.0% $ 3,743 $ 5,153 $ 1,411 3.0% 511,700 $ Los Angeles 90042 0.7% $ 443 9.6% $ 2,127 $ 2,315 $ 187 4.0% 913,200 $ Los Angeles 90045 8.5% $ 576 15.1% $ 3,627 $ 4,009 $ 382 3.8% 1,232,200 $ Los Angeles 90046 1.3% $ 696 -3.9% $ 3,426 $ 5,566 $ 2,140 2.7% 1,507,200 $ Los Angeles 90048 13.6% $ 759 -0.5% $ 3,744 $ 6,643 $ 2,899 2.4% 1,624,800 $ Los Angeles 90049 5.6% $ 801 11.5% $ 3,743 $ 7,057 $ 3,314 2.2% 1,066,400 $ Los Angeles 90064 8.1% $ 693 6.3% $ 3,478 $ 4,627 $ 1,149 3.1% 1,126,600 $ Los Angeles 90066 9.8% $ 710 4.0% $ 3,793 $ 4,990 $ 1,197 3.2% 1,193,500 $ Los Angeles 90068 7.8% $ 612 7.7% $ 3,944 $ 5,321 $ 1,377 3.2% 2,096,600 $ Manhattan Beach 90266 18.3% $ 1,141 14.2% $ 3,856 $ 9,078 $ 5,223 1.8% 896,900 $ Marina del Rey 90292 6.7% $ 604 6.2% $ 3,517 $ 3,954 $ 436 3.8% 551,400 $ Montrose 91020 6.2% $ 407 -1.0% $ 2,676 $ 2,455 $ (221) 4.7% 433,400 $ North Hills 91343 10.6% $ 267 7.6% $ 2,446 $ 1,931 $ (515) 5.4% 531,800 $ Northridge 91325 10.7% $ 292 3.5% $ 2,357 $ 2,352 $ (5) 4.3% 2,251,700 $ Pacific Palisades 90272 4.8% $ 926 -0.5% $ 4,642 $ 10,019 $ 5,378 2.0% Palos Verdes Estates 90274 1,640,200 $ -2.3% $ 674 8.7% $ 3,793 $ 7,467 $ 3,674 2.2% 911,500 $ Redondo Beach 90277 6.0% $ 597 5.6% $ 3,147 $ 4,093 $ 946 3.3% 804,800 $ Redondo Beach 90278 11.2% $ 485 4.1% $ 3,285 $ 3,587 $ 302 3.9% 428,300 $ Reseda 91335 11.0% $ 311 2.5% $ 2,359 $ 1,900 $ (459) 5.3% 472,300 $ San Pedro 90731 8.7% $ 363 3.2% $ 1,668 $ 2,085 $ 417 3.4% 460,400 $ San Pedro 90732 6.7% $ 343 6.5% $ 1,939 $ 2,054 $ 115 4.0% 16 of 58 OC Housing News info@ochousingnews.com Shevy Akason 877-409-8515 January 2016
Market Performance and Trends: West Los Angeles County, Major Cities, and ZipsMarket Performance and Trends: West Los Angeles County, Major Cities, and Zips Median Resale $ Resale % Change YoY Resale $/SF Change YoY Rent % Median Rent $ Cost of Ownership Ownership Prem./Disc. Cap Rate City Santa Monica 90402 2,832,500 $ 3.3% $ 1,239 -8.7% $ 3,631 $ 12,592 $ 8,961 1.2% 1,183,300 $ Santa Monica 90403 2.5% $ 825 1.2% $ 3,715 $ 5,062 $ 1,347 3.0% 755,800 $ Santa Monica 90404 7.3% $ 661 5.8% $ 3,310 $ 3,505 $ 196 4.2% 1,359,800 $ Santa Monica 90405 6.6% $ 906 6.4% $ 3,577 $ 6,153 $ 2,576 2.5% 842,100 $ Sherman Oaks 91403 7.2% $ 450 1.9% $ 2,721 $ 3,760 $ 1,038 3.1% 857,300 $ Sherman Oaks 91423 7.0% $ 471 4.3% $ 2,669 $ 3,684 $ 1,015 3.0% 754,800 $ Tarzana 91356 7.4% $ 339 10.9% $ 2,611 $ 3,198 $ 586 3.3% 544,800 $ Torrance 90501 2.4% $ 404 3.4% $ 2,459 $ 2,404 $ (54) 4.3% 613,900 $ Torrance 90502 -24.3% $ 316 0.4% $ 1,806 $ 2,732 $ 926 2.8% 668,700 $ Torrance 90503 6.7% $ 453 4.4% $ 2,725 $ 2,957 $ 232 3.9% 579,300 $ Torrance 90504 5.9% $ 417 2.8% $ 2,616 $ 2,598 $ (18) 4.3% 772,300 $ Torrance 90505 -2.3% $ 458 8.1% $ 3,004 $ 3,485 $ 481 3.7% 479,000 $ Valencia 91354 5.3% $ 275 4.5% $ 2,527 $ 2,117 $ (410) 5.1% 430,100 $ Valencia 91355 7.5% $ 302 5.7% $ 1,877 $ 1,930 $ 53 4.2% 810,800 $ Valley Village 91607 3.9% $ 415 9.3% $ 2,790 $ 3,566 $ 776 3.3% 1,662,600 $ Venice 90291 12.9% $ 1,155 10.2% $ 3,709 $ 7,547 $ 3,837 2.1% 709,900 $ Walnut 91789 -1.5% $ 370 3.2% $ 2,616 $ 3,182 $ 566 3.5% 536,900 $ West Hills 91307 6.8% $ 340 4.5% $ 2,793 $ 2,386 $ (407) 5.0% 682,400 $ West Hollywood 90069 21.0% $ 704 4.8% $ 3,488 $ 2,941 $ (547) 4.9% 460,300 $ Winnetka 91306 8.9% $ 293 3.3% $ 2,474 $ 2,026 $ (449) 5.2% 17 of 58 OC Housing News info@ochousingnews.com Shevy Akason 877-409-8515 January 2016
Market Timing Rating and Valuations: West Los Angeles County, Major Cities, and ZipsMarket Timing Rating and Valuations: West Los Angeles County, Major Cities, and Zips % Over/Under Historic Premium % Over/Under Historic Prem. Median Rental Parity Rental Parity Rating City Agoura Hills $ 687,600 621,900 $ 9 24.3% 8.0% -16.3% $ 672,700 550,300 $ Altadena 1 5.4% 25.5% 20.1% 2,211,100 $ 884,100 $ Beverly Hills 6 136.7% 143.6% 6.9% $ 642,600 600,500 $ Burbank 7 3.5% 7.4% 3.9% 1,035,900 $ 729,000 $ Calabasas 9 70.9% 38.9% -32.0% $ 368,400 399,800 $ Canoga Park 8 13.8% -11.9% -25.7% $ 413,100 503,600 $ Carson 7 -3.3% -18.1% -14.7% $ 483,900 548,900 $ Chatsworth 7 8.7% -9.4% -18.1% $ 739,300 708,700 $ Culver City 7 6.5% 5.5% -1.0% $ 689,600 612,900 $ Encino 6 25.7% 13.1% -12.6% $ 418,300 500,300 $ Gardena 8 5.0% -17.0% -22.0% $ 631,300 504,600 $ Glendale 7 21.5% 23.1% 1.6% $ 534,300 552,300 $ Granada Hills 7 3.1% -1.7% -4.8% $ 485,900 529,800 $ Harbor City 8 13.8% -11.6% -25.4% $ 485,000 655,700 $ Hawthorne 8 -18.5% -22.2% -3.7% 1,394,100 $ 840,100 $ Hermosa Beach 6 62.6% 60.3% -2.4% $ 368,200 377,800 $ Inglewood 6 9.6% -0.8% -10.4% 1,564,100 $ 798,100 $ La Canada Flintridge 1 58.7% 94.6% 35.9% $ 728,300 716,600 $ La Crescenta 7 14.5% 0.8% -13.7% $ 523,400 491,400 $ Lomita 9 39.0% 10.8% -28.3% $ 462,000 490,100 $ Long Beach 7 2.2% -6.8% -9.0% $ 654,600 721,100 $ Los Angeles (City) 6 -23.1% -9.3% 13.8% 2,022,100 $ 883,400 $ Malibu 2 92.4% 119.3% 26.8% 2,096,600 $ 860,100 $ Manhattan Beach 1 67.3% 135.1% 67.8% $ 896,900 784,700 $ Marina del Rey 8 11.1% 10.0% -1.1% $ 547,800 602,700 $ Montrose 7 8.2% -9.6% -17.8% $ 433,400 545,600 $ North Hills 8 -3.1% -20.3% -17.2% $ 472,600 484,400 $ North Hollywood 7 -2.9% -5.1% -2.2% $ 600,500 687,400 $ Northridge 7 -8.4% -10.5% -2.1% 2,251,700 $ 1,035,500 $ Pacific Palisades 3 103.8% 122.8% 19.0% $ 570,200 646,400 $ Playa del Rey 10 20.8% -13.4% -34.1% 1,093,200 $ 853,300 $ Rancho Palos Verdes 10 71.1% 26.8% -44.3% $ 852,900 695,300 $ Redondo Beach 7 21.0% 20.1% -0.9% $ 428,300 526,300 $ Reseda 8 -9.3% -18.5% -9.3% $ 467,700 433,500 $ San Pedro 10 34.9% 5.0% -29.9% 1,196,800 $ 801,300 $ Santa Monica 1 16.2% 51.3% 35.0% $ 735,500 627,700 $ Sherman Oaks 8 21.0% 13.5% -7.5% 18 of 58 OC Housing News info@ochousingnews.com Shevy Akason 877-409-8515 January 2016
Market Timing Rating and Valuations: West Los Angeles County, Major Cities, and ZipsMarket Timing Rating and Valuations: West Los Angeles County, Major Cities, and Zips % Over/Under Historic Premium % Over/Under Historic Prem. Median Rental Parity Rental Parity Rating City $ 927,700 821,500 $ Studio City 7 23.0% 17.3% -5.7% $ 395,400 535,500 $ Sylmar 10 -6.8% -25.4% -18.6% $ 559,700 591,000 $ Tarzana 10 21.2% -5.0% -26.2% $ 591,500 600,700 $ Torrance 10 17.1% -3.0% -20.1% $ 472,500 548,500 $ Valencia 10 6.8% -14.8% -21.6% $ 782,400 622,300 $ Valley Village 9 40.8% 24.1% -16.6% 1,597,700 $ 883,100 $ Venice 1 -9.1% 86.3% 95.4% $ 709,900 583,500 $ Walnut 7 36.2% 21.8% -14.4% $ 574,300 610,200 $ West Hills 8 2.2% -6.6% -8.8% $ 695,600 778,300 $ West Hollywood 7 -9.1% -11.9% -2.7% $ 460,300 551,900 $ Winnetka 8 -2.3% -17.4% -15.2% $ 687,600 621,900 $ Agoura Hills 91301 9 24.3% 8.0% -16.3% $ 672,700 550,300 $ Altadena 91001 1 5.4% 25.5% 20.1% 2,717,800 $ 872,900 $ Beverly Hills 90210 7 195.7% 211.1% 15.4% 1,541,600 $ 958,900 $ Beverly Hills 90211 4 64.5% 58.7% -5.8% $ 598,000 572,700 $ Burbank 91501 6 12.7% 4.5% -8.2% $ 623,700 644,500 $ Burbank 91504 10 14.8% -2.7% -17.5% $ 628,000 547,800 $ Burbank 91505 7 4.4% 12.4% 8.0% 1,124,800 $ 748,600 $ Calabasas 91302 8 65.1% 43.5% -21.6% $ 483,900 548,900 $ Chatsworth 91311 7 8.7% -9.4% -18.1% $ 510,800 633,300 $ Culver City 90230 10 7.9% -19.8% -27.7% $ 383,000 357,000 $ Gardena 90247 3 11.6% 9.0% -2.7% $ 571,200 573,600 $ Glendale 91202 10 29.6% -4.7% -34.3% $ 628,600 501,000 $ Glendale 91206 4 29.7% 18.3% -11.5% $ 810,900 594,400 $ Glendale 91207 10 74.7% 37.2% -37.5% $ 829,000 587,900 $ Glendale 91208 6 49.8% 40.4% -9.3% $ 537,200 552,300 $ Granada Hills 91344 7 3.1% -1.0% -4.1% $ 482,100 531,500 $ Harbor City 90710 8 15.0% -12.5% -27.5% 1,564,100 $ 798,100 $ La Canada Flintridge 91011 1 62.6% 94.6% 31.9% $ 728,300 716,600 $ La Crescenta 91214 7 14.1% 0.8% -13.3% $ 523,400 491,400 $ Lomita 90717 9 36.0% 10.8% -25.2% $ 293,000 465,000 $ Long Beach 90802 6 -40.4% -36.4% 4.0% $ 660,700 557,100 $ Long Beach 90803 10 56.1% 16.1% -40.0% $ 359,700 419,700 $ Long Beach 90804 9 3.5% -17.8% -21.3% $ 353,300 431,200 $ Long Beach 90805 10 19.7% -19.1% -38.8% $ 353,300 431,200 $ Long Beach 90805 10 19.7% -19.1% -38.8% $ 422,800 368,700 $ Long Beach 90806 10 52.5% 13.9% -38.6% 19 of 58 OC Housing News info@ochousingnews.com Shevy Akason 877-409-8515 January 2016
Market Timing Rating and Valuations: West Los Angeles County, Major Cities, and ZipsMarket Timing Rating and Valuations: West Los Angeles County, Major Cities, and Zips % Over/Under Historic Premium % Over/Under Historic Prem. Median Rental Parity Rental Parity Rating City $ 533,500 347,200 $ Long Beach 90807 9 74.4% 48.2% -26.1% $ 571,900 502,300 $ Long Beach 90808 7 13.0% 8.8% -4.2% $ 299,800 263,600 $ Long Beach 90813 5 -2.0% 11.7% 13.7% $ 617,400 498,700 $ Long Beach 90814 5 29.4% 24.6% -4.8% $ 582,300 549,200 $ Long Beach 90815 7 15.1% 5.0% -10.1% $ 806,300 769,200 $ Los Angeles 90004 10 44.2% 6.1% -38.0% $ 607,700 656,500 $ Los Angeles 90005 10 48.5% -8.7% -57.1% $ 460,800 511,700 $ Los Angeles 90012 8 -5.2% -9.8% -4.5% $ 877,200 577,100 $ Los Angeles 90019 2 3.8% 46.7% 42.9% $ 441,800 518,900 $ Los Angeles 90020 9 17.4% -16.7% -34.1% $ 834,800 694,700 $ Los Angeles 90024 10 43.9% 16.9% -27.0% $ 772,100 830,200 $ Los Angeles 90025 8 14.7% -7.5% -22.2% $ 826,900 769,800 $ Los Angeles 90026 2 -11.1% 5.6% 16.7% 1,205,000 $ 712,300 $ Los Angeles 90027 6 53.4% 68.4% 15.0% $ 828,000 850,100 $ Los Angeles 90034 6 3.2% -1.1% -4.4% $ 973,900 729,400 $ Los Angeles 90035 4 15.8% 32.3% 16.6% 1,205,200 $ 835,000 $ Los Angeles 90036 2 11.4% 39.4% 28.0% $ 511,700 474,600 $ Los Angeles 90042 4 -5.0% 8.6% 13.6% $ 913,200 809,100 $ Los Angeles 90045 6 20.4% 13.2% -7.2% 1,232,200 $ 764,300 $ Los Angeles 90046 1 14.2% 64.9% 50.6% 1,507,200 $ 835,200 $ Los Angeles 90048 1 28.8% 81.6% 52.8% 1,624,800 $ 835,100 $ Los Angeles 90049 9 110.5% 86.8% -23.6% 1,066,400 $ 775,900 $ Los Angeles 90064 7 37.1% 33.6% -3.5% 1,126,600 $ 846,300 $ Los Angeles 90066 6 14.8% 30.2% 15.3% 1,193,500 $ 879,800 $ Los Angeles 90068 4 17.8% 36.1% 18.3% 2,096,600 $ 860,100 $ Manhattan Beach 90266 1 66.1% 135.1% 69.1% $ 896,900 784,700 $ Marina del Rey 90292 8 11.0% 10.0% -1.0% $ 551,400 597,000 $ Montrose 91020 7 7.9% -8.3% -16.2% $ 433,400 545,600 $ North Hills 91343 8 -3.1% -20.3% -17.2% $ 531,800 525,800 $ Northridge 91325 9 21.6% -1.0% -22.6% 2,251,700 $ 1,035,500 $ Pacific Palisades 90272 3 103.5% 122.8% 19.3% 1,640,200 $ 846,100 $ Palos Verdes Estates 90274 4 94.0% 105.6% 11.6% $ 911,500 702,100 $ Redondo Beach 90277 8 31.5% 27.0% -4.5% $ 804,800 732,900 $ Redondo Beach 90278 7 12.3% 9.7% -2.5% $ 428,300 526,300 $ Reseda 91335 8 -9.3% -18.5% -9.3% $ 472,300 372,200 $ San Pedro 90731 9 45.2% 23.4% -21.8% $ 460,400 432,500 $ San Pedro 90732 10 32.7% 4.2% -28.5% 20 of 58 OC Housing News info@ochousingnews.com Shevy Akason 877-409-8515 January 2016
Market Timing Rating and Valuations: West Los Angeles County, Major Cities, and ZipsMarket Timing Rating and Valuations: West Los Angeles County, Major Cities, and Zips % Over/Under Historic Premium % Over/Under Historic Prem. Median Rental Parity Rental Parity Rating City 2,832,500 $ 810,000 $ Santa Monica 90402 1 179.8% 242.7% 62.9% 1,183,300 $ 828,800 $ Santa Monica 90403 3 5.9% 34.2% 28.3% $ 755,800 738,400 $ Santa Monica 90404 7 5.4% 5.1% -0.3% 1,359,800 $ 798,000 $ Santa Monica 90405 1 14.0% 72.0% 58.0% $ 842,100 607,100 $ Sherman Oaks 91403 4 28.4% 40.9% 12.5% $ 857,300 595,500 $ Sherman Oaks 91423 6 25.8% 34.9% 9.1% $ 754,800 582,600 $ Tarzana 91356 6 22.5% 22.6% 0.0% $ 544,800 548,500 $ Torrance 90501 10 16.3% -1.0% -17.4% $ 613,900 402,800 $ Torrance 90502 10 120.2% 48.8% -71.4% $ 668,700 607,900 $ Torrance 90503 10 31.3% 6.9% -24.5% $ 579,300 583,600 $ Torrance 90504 10 16.5% 0.2% -16.3% $ 772,300 670,200 $ Torrance 90505 7 38.4% 14.5% -23.9% $ 479,000 563,800 $ Valencia 91354 10 12.5% -15.7% -28.2% $ 430,100 418,600 $ Valencia 91355 10 36.2% -1.5% -37.7% $ 810,800 622,300 $ Valley Village 91607 5 4.6% 26.8% 22.2% 1,662,600 $ 827,500 $ Venice 90291 1 -9.2% 104.4% 113.6% $ 709,900 583,500 $ Walnut 91789 7 36.2% 21.8% -14.4% $ 536,900 623,000 $ West Hills 91307 10 4.6% -13.2% -17.8% $ 682,400 778,100 $ West Hollywood 90069 7 -8.1% -15.9% -7.8% $ 460,300 551,900 $ Winnetka 91306 8 -2.3% -17.4% -15.2% 21 of 58 OC Housing News info@ochousingnews.com Shevy Akason 877-409-8515 January 2016
Orange County Housing Market News Historically, properties in this market sell at a 0.6% premium. Today's discount is 3.5%. This market is 4.1% undervalued. Median home price is $594,700 with a rental parity value of $611,600. This market's discount is $16,900. Monthly payment affordability has been improving over the last 3 month(s). Momentum suggests improving affordability. Resale prices on a $/SF basis increased from $392/SF to $394/SF. Resale prices have been rising for 11 month(s). Over the last 12 months, resale prices rose 5.1% indicating a longer term upward price trend. Median rental rates declined $8 last month from $2,750 to $2,741. The current capitalization rate (rent/price) is 4.4%. Rents have been rising for 12 month(s). Price momentum signals rising rents over the next three months. Market rating = 8 Median Home Price and Rental Parity trailing twelve months Date Rating Median Rental Parity Historic Value 1/2015 8 560,800 $ 601,600 $ 2/2015 8 558,800 $ 597,800 $ 3/2015 8 560,500 $ 593,400 $ 4/2015 8 563,400 $ 600,700 $ 5/2015 8 569,400 $ 599,500 $ 6/2015 8 577,800 $ 595,100 $ 7/2015 8 586,900 $ 597,500 $ 8/2015 8 592,800 $ 617,000 $ 9/2015 8 594,400 $ 622,300 $ 10/2015 8 597,000 $ 627,200 $ 11/2015 8 596,600 $ 615,000 $ 12/2015 8 594,700 $ 611,600 $ $640,000 605,294 $ 601,470 $ 597,043 $ 604,388 $ 603,181 $ 598,754 $ 601,169 $ 620,788 $ 626,121 $ 631,051 $ 618,776 $ 615,355 $ $620,000 $600,000 $580,000 $560,000 $540,000 Median Rental Parity Historic Value $520,000 1/2015 2/2015 3/2015 4/2015 5/2015 6/2015 7/2015 8/2015 9/2015 10/2015 11/2015 12/2015 Resale $/SF and year-over-year percentage change trailing twelve months Date ± Typ. Value $/SF % Change 1/2015 -5.7% 374 $ 5.9% 2/2015 -6.8% 375 $ 4.8% 3/2015 -6.9% 375 $ 4.7% 4/2015 -6.7% 377 $ 4.5% 5/2015 -6.2% 378 $ 3.8% 6/2015 -5.3% 380 $ 3.5% 7/2015 -3.9% 384 $ 3.3% 8/2015 -3.5% 386 $ 3.7% 9/2015 -4.0% 388 $ 3.6% 10/2015 -5.0% 391 $ 4.5% 11/2015 -4.7% 392 $ 4.7% 12/2015 -4.1% 394 $ 5.1% 0.00613984 $400 $384 $386 $388 $391 $392 $394 $395 $390 $385 $374 $375 $375 $377 $378 $380 $380 $375 $370 $365 $360 1/2015 2/2015 3/2015 4/2015 5/2015 6/2015 7/2015 8/2015 9/2015 10/2015 11/2015 12/2015 Rental rate and year-over-year percentage change trailing twelve months Date % Change Rent Own Historic Cost to Own Relative to Rent 1/2015 4.9% 2,616 $ 2,494 $ $ 2/2015 5.0% 2,599 $ 2,454 $ $ 3/2015 5.1% 2,599 $ 2,441 $ $ 4/2015 5.1% 2,599 $ 2,441 $ $ 5/2015 5.4% 2,648 $ 2,469 $ $ 6/2015 5.5% 2,674 $ 2,516 $ $ 7/2015 5.6% 2,708 $ 2,590 $ $ 8/2015 5.9% 2,749 $ 2,632 $ $ 9/2015 6.1% 2,766 $ 2,647 $ $ 10/2015 6.0% 2,758 $ 2,636 $ $ 11/2015 6.0% 2,750 $ 2,645 $ $ 12/2015 6.0% 2,742 $ 2,652 $ $ $2,708 $2,749 $2,766 $2,758 $2,750 $2,674 $2,742 $2,900 $2,648 $2,616 $2,599 $2,599 $2,599 2,632 2,615 2,615 2,615 2,665 2,691 2,724 2,766 2,783 2,774 2,767 2,759 $2,800 $2,700 $2,600 $2,500 $2,400 $2,300 Rent Own Historic Cost to Own Relagve to Rent $2,200 1/2015 2/2015 3/2015 4/2015 5/2015 6/2015 7/2015 8/2015 9/2015 10/2015 11/2015 12/2015 22 of 58 OC Housing News info@ochousingnews.com Shevy Akason 877-409-8515 January 2016
Orange County median home price since January 1988 $800,000 Median Resale Projecgon Rental Parity Historic Value $700,000 $600,000 $500,000 $400,000 $300,000 $200,000 $100,000 $0 1/1988 1/1989 1/1990 1/1991 1/1992 1/1993 1/1995 1/1996 1/1998 1/1999 1/2000 1/2001 1/2002 1/2003 1/2005 1/2006 1/2008 1/2009 1/2010 1/2011 1/2012 1/2013 1/2015 1/2016 1/1994 1/1997 1/2004 1/2007 1/2014 1/2017 Orange County median rent and monthly cost of ownership since January 1988 Median Rent Cost to Own Historic Cost to Own Relagve to Rent $4,500 $4,000 $3,500 $3,000 $2,500 $2,000 $1,500 $1,000 $500 $0 1/1988 1/1989 1/1990 1/1991 1/1992 1/1993 1/1995 1/1996 1/1998 1/1999 1/2000 1/2001 1/2002 1/2003 1/2005 1/2006 1/2008 1/2009 1/2010 1/2011 1/2012 1/2013 1/2015 1/1994 1/1997 1/2004 1/2007 1/2014 23 of 58 OC Housing News info@ochousingnews.com Shevy Akason 877-409-8515 January 2016
Resale $/SF Year-over-Year Percentage Change: Orange County since January 1989Resale $/SF Year-over-Year Percentage Change: Orange County since January 1989 40% 35% Appreciagon rates in excess of 7% are not sustainable. Long periods of excessive appreciagon lead to a crash. 30% 25% 20% 15% 10% 5% Normal and sustainable 0% -5% Falling/Correcgng -10% -15% -20% 1/1989 1/1990 1/1995 1/1996 1/1998 1/1999 1/2000 1/2005 1/2006 1/2008 1/2009 1/2010 1/2015 1/1991 1/1992 1/1993 1/1994 1/1997 1/2001 1/2002 1/2003 1/2004 1/2007 1/2011 1/2012 1/2013 1/2014 Rental $/SF Year-over-Year Percentage Change: Orange County since January 1989 14% 12% Rental rates in excess of 7% are not sustainable. Long periods of excessive appreciagon lead to a crash. 10% 8% 6% Normal and sustainable 4% 2% Weak 0% -2% Falling/Correcgng -4% -6% -8% 1/1989 1/1990 1/1991 1/1992 1/1993 1/1994 1/1995 1/1996 1/1997 1/1998 1/1999 1/2000 1/2001 1/2002 1/2003 1/2004 1/2005 1/2006 1/2007 1/2008 1/2009 1/2010 1/2011 1/2012 1/2013 1/2014 1/2015 24 of 58 OC Housing News info@ochousingnews.com Shevy Akason 877-409-8515 January 2016
Historic Median Home Price Relative to Rental Parity: Orange County since January 1988Historic Median Home Price Relative to Rental Parity: Orange County since January 1988 Value Relagve to Rental Parity Historic Norm 91.0% 84.0% Stable period between housing bubbles from 1993-1999 establishes historic norm. 77.0% 70.0% 63.0% 56.0% 49.0% Discount or Premium 42.0% 35.0% 28.0% 21.0% 14.0% 7.0% 0.0% -7.0% -14.0% -21.0% -28.0% -35.0% 1/1988 1/1989 1/1990 1/1991 1/1992 1/1993 1/1995 1/1996 1/1998 1/1999 1/2000 1/2001 1/2002 1/2003 1/2005 1/2006 1/2008 1/2009 1/2010 1/2011 1/2012 1/2013 1/2015 1/1994 1/1997 1/2004 1/2007 1/2014 OCHN Market Timing System Rating: Orange County since January 1988 10 9 Values 7-10: Undervalued Market: Strong Buy Recommendagon 8 7 6 Values 4-6: Neutral Market, Weak Buy Recommendagon 5 4 3 Values 1-3: Inflated or Weak Market: Consider Selling. Do not Buy. 2 1 0 1/1988 1/1989 1/1990 1/1991 1/1992 1/1993 1/1994 1/1995 1/1996 1/1997 1/1998 1/1999 1/2000 1/2001 1/2002 1/2003 1/2004 1/2005 1/2006 1/2007 1/2008 1/2009 1/2010 1/2011 1/2012 1/2013 1/2014 1/2015 25 of 58 OC Housing News info@ochousingnews.com Shevy Akason 877-409-8515 January 2016
Cash Investor Capitalization Rate: Orange County since January 1988Cash Investor Capitalization Rate: Orange County since January 1988 Capitalizagon Rate Mortgage Interest Rate 12.0% 10.0% 8.0% 6.0% 4.0% 2.0% 0.0% 1/1988 1/1989 1/1990 1/1991 1/1992 1/1993 1/1995 1/1996 1/1998 1/1999 1/2000 1/2001 1/2002 1/2003 1/2005 1/2006 1/2008 1/2009 1/2010 1/2011 1/2012 1/2013 1/2015 1/1994 1/1997 1/2004 1/2007 1/2014 Financed Investor Cash-on-Cash Return: Orange County since January 1988 15.0% 10.0% 5.0% 0.0% -5.0% -10.0% -15.0% -20.0% -25.0% 1/1988 1/1989 1/1990 1/1995 1/1996 1/1998 1/1999 1/2000 1/2005 1/2006 1/2008 1/2009 1/2010 1/2015 1/1991 1/1992 1/1993 1/1994 1/1997 1/2001 1/2002 1/2003 1/2004 1/2007 1/2011 1/2012 1/2013 1/2014 26 of 58 OC Housing News info@ochousingnews.com Shevy Akason 877-409-8515 January 2016
Market Performance and Trends: Orange County and Major Cities and ZipsMarket Performance and Trends: Orange County and Major Cities and Zips Median Resale $ Resale % Change YoY Resale $/SF Change YoY Rent % Median Rent $ Cost of Ownership Ownership Prem./Disc. Cap Rate City Aliso Viejo 506,200 $ 3.0% $ 357 4.3% $ 2,507 $ 2,269 $ (238) 4.8% 470,600 $ Anaheim 5.5% $ 319 5.2% $ 2,183 $ 2,093 $ (90) 4.5% 627,700 $ Anaheim Hills 5.0% $ 337 3.4% $ 2,583 $ 2,796 $ 213 4.0% 625,300 $ Brea 4.9% $ 340 7.8% $ 2,561 $ 2,803 $ 242 3.9% 475,900 $ Buena Park 6.8% $ 333 3.8% $ 2,303 $ 2,128 $ (175) 4.6% 1,528,300 $ Corona Del Mar 14.2% $ 1,106 0.5% $ 4,071 $ 6,615 $ 2,543 2.6% 686,700 $ Costa Mesa 8.6% $ 458 5.9% $ 2,802 $ 3,051 $ 249 3.9% 1,019,200 $ Coto De Caza 3.6% $ 343 3.8% $ 3,584 $ 4,523 $ 939 3.4% 543,600 $ Cypress 8.2% $ 352 1.0% $ 2,533 $ 2,430 $ (103) 4.5% 801,100 $ Dana Point 9.1% $ 545 6.5% $ 2,584 $ 3,553 $ 969 3.1% 668,300 $ Fountain Valley 6.5% $ 362 4.1% $ 2,794 $ 2,985 $ 191 4.0% 524,400 $ Fullerton 5.4% $ 342 6.5% $ 2,519 $ 2,311 $ (209) 4.6% 490,200 $ Garden Grove 5.4% $ 336 4.3% $ 2,006 $ 2,176 $ 170 3.9% 678,500 $ Huntington Beach 6.2% $ 439 4.8% $ 2,718 $ 3,019 $ 301 3.8% 712,800 $ Irvine 3.7% $ 433 3.3% $ 3,006 $ 3,201 $ 196 4.0% 471,800 $ La Habra 7.5% $ 324 5.5% $ 1,801 $ 2,068 $ 268 3.7% 615,200 $ La Palma 2.5% $ 311 0.5% $ 2,628 $ 2,751 $ 122 4.1% 630,500 $ Ladera Ranch 3.2% $ 329 2.7% $ 2,907 $ 2,828 $ (79) 4.4% 1,671,100 $ Laguna Beach 4.8% $ 1,051 6.0% $ 3,571 $ 7,305 $ 3,734 2.1% 600,500 $ Laguna Hills 2.9% $ 344 5.0% $ 2,539 $ 2,585 $ 46 4.1% 719,300 $ Laguna Niguel 2.9% $ 388 4.2% $ 2,757 $ 3,211 $ 453 3.7% 228,900 $ Laguna Woods 4.5% $ 230 9.0% $ 1,731 $ 1,023 $ (708) 7.3% 575,100 $ Lake Forest 5.2% $ 342 1.4% $ 2,490 $ 2,560 $ 70 4.2% 620,000 $ Mission Viejo 5.3% $ 352 3.0% $ 2,693 $ 2,761 $ 68 4.2% 1,513,600 $ Newport Beach 6.2% $ 789 9.7% $ 3,522 $ 6,715 $ 3,193 2.2% 2,923,400 $ Newport Coast 0.6% $ 761 3.4% $ 4,456 $ 12,835 $ 8,379 1.5% 867,800 $ North Tustin 5.2% $ 362 5.5% $ 1,539 $ 4,341 $ 2,803 1.7% 581,700 $ Orange 6.5% $ 352 9.3% $ 2,588 $ 2,609 $ 22 4.3% 579,800 $ Placentia 5.5% $ 316 8.9% $ 2,397 $ 2,548 $ 151 4.0% 563,700 $ Rancho Santa Margarita 5.1% $ 343 7.4% $ 2,453 $ 2,518 $ 66 4.2% 837,300 $ San Clemente 7.1% $ 433 9.8% $ 2,622 $ 3,701 $ 1,079 3.0% 719,600 $ San Juan Capistrano 3.7% $ 351 1.6% $ 2,756 $ 3,183 $ 427 3.7% 416,600 $ Santa Ana 8.6% $ 325 5.9% $ 1,999 $ 1,862 $ (137) 4.6% 560,200 $ Tustin 6.3% $ 375 6.5% $ 2,456 $ 2,506 $ 51 4.2% 556,500 $ Westminster 7.8% $ 372 -3.4% $ 2,482 $ 2,491 $ 9 4.3% 726,200 $ Yorba Linda 4.0% $ 352 1.1% $ 3,069 $ 3,230 $ 161 4.1% 27 of 58 OC Housing News info@ochousingnews.com Shevy Akason 877-409-8515 January 2016
Market Performance and Trends: Orange County and Major Cities and ZipsMarket Performance and Trends: Orange County and Major Cities and Zips Median Resale $ Resale % Change YoY Resale $/SF Change YoY Rent % Median Rent $ Cost of Ownership Ownership Prem./Disc. Cap Rate City Anaheim 92801 426,200 $ 5.2% $ 320 4.8% $ 2,033 $ 1,909 $ (123) 4.6% 457,500 $ Anaheim 92802 4.1% $ 316 3.7% $ 2,081 $ 2,051 $ (30) 4.4% 482,800 $ Anaheim 92804 9.6% $ 318 8.1% $ 2,032 $ 2,146 $ 115 4.0% 450,600 $ Anaheim 92805 8.0% $ 331 2.4% $ 2,238 $ 1,991 $ (246) 4.8% 525,200 $ Anaheim 92806 6.2% $ 302 5.0% $ 2,357 $ 2,318 $ (39) 4.3% 514,000 $ Anaheim 92807 5.4% $ 331 5.8% $ 1,693 $ 2,279 $ 587 3.2% 558,000 $ Fullerton 92831 7.1% $ 346 4.1% $ 2,481 $ 2,442 $ (39) 4.3% 436,100 $ Fullerton 92832 7.4% $ 352 7.6% $ 2,287 $ 1,960 $ (327) 5.0% 515,000 $ Fullerton 92833 4.4% $ 342 5.7% $ 2,450 $ 2,257 $ (193) 4.6% 606,000 $ Fullerton 92835 5.0% $ 335 5.2% $ 3,103 $ 2,728 $ (375) 4.9% 453,200 $ Garden Grove 92840 2.7% $ 321 3.2% $ 1,852 $ 2,009 $ 157 3.9% 520,600 $ Garden Grove 92841 8.6% $ 341 11.6% $ 2,231 $ 2,309 $ 78 4.1% 574,200 $ Huntington Beach 92646 4.6% $ 404 3.3% $ 2,841 $ 2,535 $ (307) 4.8% 640,000 $ Huntington Beach 92647 5.3% $ 412 2.4% $ 2,650 $ 2,857 $ 207 4.0% 812,400 $ Huntington Beach 92648 6.8% $ 462 6.1% $ 3,252 $ 3,618 $ 366 3.8% 709,000 $ Huntington Beach 92649 6.7% $ 479 4.7% $ 2,465 $ 3,143 $ 679 3.3% 1,552,200 $ Newport Beach 92660 6.6% $ 678 3.9% $ 3,611 $ 6,899 $ 3,288 2.2% 1,348,500 $ Newport Beach 92663 5.2% $ 808 11.8% $ 3,574 $ 5,943 $ 2,368 2.5% 551,400 $ Orange 92867 4.5% $ 343 8.1% $ 2,249 $ 2,527 $ 279 3.9% 579,800 $ Orange 92869 5.5% $ 316 8.9% $ 2,397 $ 2,548 $ 151 4.0% 28 of 58 OC Housing News info@ochousingnews.com Shevy Akason 877-409-8515 January 2016
Market Timing Rating and Valuations: Orange County and Major Cities and ZipsMarket Timing Rating and Valuations: Orange County and Major Cities and Zips % Over/Under Historic Premium % Over/Under Historic Prem. Median Rental Parity Rental Parity Rating City Aliso Viejo $ 506,200 559,300 $ 8 -4.7% -9.6% -4.9% $ 470,600 487,100 $ Anaheim 8 4.5% -3.5% -8.0% $ 627,700 576,300 $ Anaheim Hills 9 22.2% 7.5% -14.7% $ 625,300 571,300 $ Brea 7 14.9% 9.5% -5.4% $ 475,900 513,700 $ Buena Park 8 -1.5% -8.0% -6.5% 1,528,300 $ 908,300 $ Corona Del Mar 7 82.6% 59.6% -23.0% $ 686,700 625,100 $ Costa Mesa 7 13.8% 8.3% -5.5% 1,019,200 $ 799,600 $ Coto De Caza 10 54.3% 27.3% -27.0% $ 543,600 565,100 $ Cypress 7 17.6% -3.0% -20.6% $ 801,100 576,400 $ Dana Point 7 26.8% 34.1% 7.3% $ 668,300 623,400 $ Fountain Valley 9 21.0% 9.0% -12.0% $ 524,400 562,100 $ Fullerton 8 -4.4% -8.2% -3.8% $ 490,200 447,400 $ Garden Grove 8 5.3% 8.9% 3.6% $ 678,500 606,400 $ Huntington Beach 8 15.8% 10.7% -5.1% $ 712,800 670,500 $ Irvine 8 13.2% 6.7% -6.5% $ 471,800 401,700 $ La Habra 6 5.5% 15.5% 10.0% $ 615,200 586,400 $ La Palma 7 21.4% 5.6% -15.8% $ 630,500 648,600 $ Ladera Ranch 9 5.5% -4.7% -10.2% 1,671,100 $ 796,700 $ Laguna Beach 3 59.5% 107.3% 47.8% $ 600,500 566,400 $ Laguna Hills 10 27.8% 1.1% -26.7% $ 719,300 615,100 $ Laguna Niguel 8 18.7% 14.0% -4.7% $ 228,900 386,000 $ Laguna Woods 10 -10.4% -40.9% -30.5% $ 575,100 555,500 $ Lake Forest 6 8.8% 2.1% -6.7% $ 620,000 600,800 $ Mission Viejo 9 11.6% 2.6% -9.1% 1,513,600 $ 785,800 $ Newport Beach 6 75.3% 88.3% 13.0% 2,923,400 $ 994,000 $ Newport Coast 1 105.3% 181.3% 76.0% $ 867,800 343,300 $ North Tustin 1 46.4% 151.1% 104.7% $ 581,700 577,300 $ Orange 6 -9.6% -0.2% 9.4% $ 579,800 534,800 $ Placentia 7 -1.3% 3.4% 4.7% $ 563,700 547,200 $ Rancho Santa Margarita 7 2.2% 0.0% -2.1% $ 837,300 585,000 $ San Clemente 5 28.9% 40.6% 11.7% $ 719,600 614,700 $ San Juan Capistrano 6 22.7% 14.8% -7.8% $ 416,600 445,900 $ Santa Ana 7 -1.4% -8.2% -6.8% $ 560,200 547,800 $ Tustin 8 6.3% 2.2% -4.0% $ 556,500 553,700 $ Westminster 3 5.8% 4.1% -1.7% $ 726,200 684,800 $ Yorba Linda 8 23.6% 4.9% -18.7% 29 of 58 OC Housing News info@ochousingnews.com Shevy Akason 877-409-8515 January 2016
Market Timing Rating and Valuations: Orange County and Major Cities and ZipsMarket Timing Rating and Valuations: Orange County and Major Cities and Zips % Over/Under Historic Premium % Over/Under Historic Prem. Median Rental Parity Rental Parity Rating City Anaheim 92801 $ 426,200 453,400 $ 7 -16.5% -5.6% 11.0% $ 457,500 464,200 $ Anaheim 92802 9 5.7% -2.4% -8.1% $ 482,800 453,200 $ Anaheim 92804 5 -10.0% 2.8% 12.8% $ 450,600 455,700 $ Anaheim 92805 6 -12.7% -1.5% 11.2% $ 525,200 525,900 $ Anaheim 92806 8 0.4% -1.5% -1.9% $ 514,000 377,600 $ Anaheim 92807 3 -10.9% 34.6% 45.6% $ 558,000 544,700 $ Fullerton 92831 7 -1.9% 4.1% 6.0% $ 436,100 510,200 $ Fullerton 92832 6 -12.7% -15.0% -2.3% $ 515,000 546,600 $ Fullerton 92833 9 2.3% -8.3% -10.6% $ 606,000 692,300 $ Fullerton 92835 10 47.3% -9.8% -57.1% $ 453,200 413,100 $ Garden Grove 92840 8 9.6% 8.0% -1.6% $ 520,600 497,700 $ Garden Grove 92841 7 18.2% 3.6% -14.6% $ 574,200 633,900 $ Huntington Beach 92646 10 10.2% -10.8% -21.0% $ 640,000 591,200 $ Huntington Beach 92647 8 13.1% 7.8% -5.3% $ 812,400 725,500 $ Huntington Beach 92648 10 56.1% 13.4% -42.7% $ 709,000 549,800 $ Huntington Beach 92649 8 21.8% 27.9% 6.1% 1,552,200 $ 805,600 $ Newport Beach 92660 8 83.2% 90.6% 7.4% 1,348,500 $ 797,300 $ Newport Beach 92663 3 36.5% 68.6% 32.1% $ 551,400 501,700 $ Orange 92867 6 0.6% 9.3% 8.7% $ 579,800 534,800 $ Orange 92869 7 -1.3% 3.4% 4.7% 30 of 58 OC Housing News info@ochousingnews.com Shevy Akason 877-409-8515 January 2016
Riverside County Housing Market News Historically, properties in this market sell at a 18.5% discount. Today's discount is 23.5%. This market is 4.9% undervalued. Median home price is $306,900 with a rental parity value of $397,300. This market's discount is $90,400. Monthly payment affordability has been improving over the last 3 month(s). Momentum suggests improving affordability. Resale prices on a $/SF basis increased from $172/SF to $173/SF. Resale prices have been rising for 2 month(s). Over the last 12 months, resale prices rose 4.9% indicating a longer term upward price trend. Median rental rates declined $4 last month from $1,785 to $1,781. The current capitalization rate (rent/price) is 5.6%. Rents have been rising for 12 month(s). Price momentum signals rising rents over the next three months. Market rating = 8 Median Home Price and Rental Parity trailing twelve months Date Rating Median Rental Parity Historic Value 1/2015 7 289,600 $ 389,100 $ 2/2015 8 290,500 $ 389,100 $ 3/2015 8 292,300 $ 386,200 $ 4/2015 8 294,800 $ 392,900 $ 5/2015 8 298,100 $ 388,600 $ 6/2015 8 301,000 $ 385,700 $ 7/2015 8 305,100 $ 388,000 $ 8/2015 8 306,300 $ 398,400 $ 9/2015 8 306,500 $ 401,800 $ 10/2015 8 306,100 $ 406,200 $ 11/2015 8 307,400 $ 399,300 $ 12/2015 8 306,900 $ 397,300 $ $500,000 316,987 $ 316,987 $ 314,625 $ 320,083 $ 316,580 $ 314,217 $ 316,091 $ 324,563 $ 327,333 $ 330,918 $ 325,297 $ 323,667 $ $400,000 $300,000 $200,000 $100,000 Median Rental Parity Historic Value $- 1/2015 2/2015 3/2015 4/2015 5/2015 6/2015 7/2015 8/2015 9/2015 10/2015 11/2015 12/2015 Resale $/SF and year-over-year percentage change trailing twelve months Date ± Typ. Value $/SF % Change 1/2015 -5.6% 165 $ 7.4% 2/2015 -6.5% 164 $ 5.4% 3/2015 -6.5% 166 $ 4.7% 4/2015 -6.3% 168 $ 4.2% 5/2015 -5.7% 169 $ 3.9% 6/2015 -4.9% 170 $ 3.6% 7/2015 -3.7% 171 $ 3.6% 8/2015 -3.6% 172 $ 3.4% 9/2015 -4.2% 172 $ 3.9% 10/2015 -5.3% 172 $ 4.3% 11/2015 -5.3% 172 $ 4.7% 12/2015 -4.9% 173 $ 4.9% $168 $169 $170 $171 $172 $172 $172 $172 $173 $175 $170 $165 $164 $166 $165 $160 $155 $150 1/2015 2/2015 3/2015 4/2015 5/2015 6/2015 7/2015 8/2015 9/2015 10/2015 11/2015 12/2015 -0.1853326 Rental rate and year-over-year percentage change trailing twelve months Date % Change Rent Own Historic Cost to Own Relative to Rent 1/2015 2.2% 1,692 $ 1,287 $ $ 2/2015 2.2% 1,692 $ 1,270 $ $ 3/2015 2.4% 1,692 $ 1,267 $ $ 4/2015 2.4% 1,700 $ 1,273 $ $ 5/2015 2.7% 1,717 $ 1,291 $ $ 6/2015 2.9% 1,733 $ 1,315 $ $ 7/2015 3.4% 1,758 $ 1,351 $ $ 8/2015 3.7% 1,775 $ 1,366 $ $ 9/2015 4.0% 1,786 $ 1,370 $ $ 10/2015 4.2% 1,786 $ 1,357 $ $ 11/2015 4.6% 1,786 $ 1,361 $ $ 12/2015 5.0% 1,781 $ 1,365 $ $ $1,700 $1,758 $1,775 $1,786 $1,786 $1,786 $1,692 $1,692 $1,692 $1,717 $1,733 $1,781 $2,000 1,378 1,378 1,378 1,385 1,399 1,412 1,432 1,446 1,455 1,455 1,455 1,451 $1,800 $1,600 $1,400 $1,200 Rent Own Historic Cost to Own Relagve to Rent $1,000 1/2015 2/2015 3/2015 4/2015 5/2015 6/2015 7/2015 8/2015 9/2015 10/2015 11/2015 12/2015 31 of 58 OC Housing News info@ochousingnews.com Shevy Akason 877-409-8515 January 2016
Riverside County median home price since January 1988 $450,000 Median Resale Rental Parity Historic Value Projecgon $400,000 $350,000 $300,000 $250,000 $200,000 $150,000 $100,000 $50,000 $0 1/1988 1/1989 1/1990 1/1991 1/1992 1/1993 1/1995 1/1996 1/1998 1/1999 1/2000 1/2001 1/2002 1/2003 1/2005 1/2006 1/2008 1/2009 1/2010 1/2011 1/2012 1/2013 1/2015 1/2016 1/1994 1/1997 1/2004 1/2007 1/2014 1/2017 Riverside County median rent and monthly cost of ownership since January 1988 Median Rent Cost to Own Historic Cost to Own Relagve to Rent $3,000 $2,500 $2,000 $1,500 $1,000 $500 $0 1/1989 1/1990 1/1991 1/1992 1/1993 1/1995 1/1996 1/1998 1/1999 1/2000 1/2001 1/2002 1/2003 1/2005 1/2006 1/2008 1/2009 1/2010 1/2011 1/2012 1/2013 1/2015 1/2016 1/1994 1/1997 1/2004 1/2007 1/2014 1/2017 32 of 58 OC Housing News info@ochousingnews.com Shevy Akason 877-409-8515 January 2016
Resale $/SF Year-over-Year Percentage Change: Riverside County since January 1989Resale $/SF Year-over-Year Percentage Change: Riverside County since January 1989 50% 45% Appreciagon rates in excess of 7% are not sustainable. Long periods of excessive appreciagon lead to a crash. 40% 35% 30% 25% 20% 15% 10% 5% Normal and sustainable 0% -5% -10% -15% Falling/Correcgng -20% -25% -30% -35% -40% -45% -50% 1/1989 1/1990 1/1995 1/1996 1/1998 1/1999 1/2000 1/2005 1/2006 1/2008 1/2009 1/2010 1/2015 1/2016 1/1991 1/1992 1/1993 1/1994 1/1997 1/2001 1/2002 1/2003 1/2004 1/2007 1/2011 1/2012 1/2013 1/2014 1/2017 Rental $/SF Year-over-Year Percentage Change: Riverside County since January 1989 18% 16% Rental rates in excess of 7% are not sustainable. Long periods of excessive appreciagon lead to a crash. 14% 12% 10% 8% 6% Normal and sustainable 4% 2% Weak 0% -2% Falling/Correcgng -4% -6% -8% 1/1989 1/1990 1/1991 1/1992 1/1993 1/1994 1/1995 1/1996 1/1997 1/1998 1/1999 1/2000 1/2001 1/2002 1/2003 1/2004 1/2005 1/2006 1/2007 1/2008 1/2009 1/2010 1/2011 1/2012 1/2013 1/2014 1/2015 1/2016 1/2017 33 of 58 OC Housing News info@ochousingnews.com Shevy Akason 877-409-8515 January 2016
Historic Median Home Price Relative to Rental Parity: Riverside County since January 1988Historic Median Home Price Relative to Rental Parity: Riverside County since January 1988 Value Relagve to Rental Parity Historic Norm 112.0% 105.0% Stable period between housing bubbles from 1993-1999 establishes historic norm. 98.0% 91.0% 84.0% 77.0% 70.0% 63.0% 56.0% Discount or Premium 49.0% 42.0% 35.0% 28.0% 21.0% 14.0% 7.0% 0.0% -7.0% -14.0% -21.0% -28.0% -35.0% -42.0% -49.0% -56.0% -63.0% 1/1989 1/1990 1/1991 1/1992 1/1993 1/1995 1/1996 1/1998 1/1999 1/2000 1/2001 1/2002 1/2003 1/2005 1/2006 1/2008 1/2009 1/2010 1/2011 1/2012 1/2013 1/2015 1/2016 1/1994 1/1997 1/2004 1/2007 1/2014 1/2017 OCHN Market Timing System Rating: Riverside County since January 1988 10 9 Values 7-10: Undervalued Market: Strong Buy Recommendagon 8 7 6 Values 4-6: Neutral Market, Weak Buy Recommendagon 5 4 3 Values 1-3: Inflated or Weak Market: Consider Selling. Do not Buy. 2 1 0 1/1988 1/1989 1/1990 1/1991 1/1992 1/1993 1/1995 1/1996 1/1998 1/1999 1/2000 1/2001 1/2002 1/2003 1/2005 1/2006 1/2008 1/2009 1/2010 1/2011 1/2012 1/2013 1/2015 1/2016 1/1994 1/1997 1/2004 1/2007 1/2014 1/2017 34 of 58 OC Housing News info@ochousingnews.com Shevy Akason 877-409-8515 January 2016
Cash Investor Capitalization Rate: Riverside County since January 1988Cash Investor Capitalization Rate: Riverside County since January 1988 Capitalizagon Rate Mortgage Interest Rate 12.0% 10.0% 8.0% 6.0% 4.0% 2.0% 0.0% 1/1988 1/1989 1/1990 1/1991 1/1992 1/1993 1/1995 1/1996 1/1998 1/1999 1/2000 1/2001 1/2002 1/2003 1/2005 1/2006 1/2008 1/2009 1/2010 1/2011 1/2012 1/2013 1/2015 1/2016 1/1994 1/1997 1/2004 1/2007 1/2014 1/2017 Financed Investor Cash-on-Cash Return: Riverside County since January 1988 30.0% 25.0% 20.0% 15.0% 10.0% 5.0% 0.0% -5.0% -10.0% -15.0% -20.0% -25.0% 1/1988 1/1989 1/1990 1/1991 1/1992 1/1993 1/1995 1/1996 1/1998 1/1999 1/2000 1/2001 1/2002 1/2003 1/2005 1/2006 1/2008 1/2009 1/2010 1/2011 1/2012 1/2013 1/2015 1/2016 1/1994 1/1997 1/2004 1/2007 1/2014 1/2017 35 of 58 OC Housing News info@ochousingnews.com Shevy Akason 877-409-8515 January 2016
Market Performance and Trends: Riverside County, Major Cities, and ZipsMarket Performance and Trends: Riverside County, Major Cities, and Zips Median Resale $ Resale % Change YoY Resale $/SF Change YoY Rent % Median Rent $ Cost of Ownership Ownership Prem./Disc. Cap Rate City Banning 202,600 $ 3.3% $ 138 6.7% $ 1,174 $ 905 $ (270) 5.6% 272,000 $ Beaumont 6.7% $ 138 0.3% $ 1,698 $ 1,209 $ (489) 6.0% 249,100 $ Cathedral City 2.6% $ 150 1.4% $ 1,592 $ 1,129 $ (464) 6.1% 406,500 $ Corona 5.5% $ 217 4.4% $ 2,145 $ 1,812 $ (333) 5.1% 160,500 $ Desert Hot Springs 12.6% $ 104 8.1% $ 967 $ 711 $ (256) 5.8% 194,100 $ Hemet 6.2% $ 116 8.0% $ 1,204 $ 870 $ (334) 6.0% 271,100 $ Indio 6.1% $ 148 2.0% $ 1,615 $ 1,201 $ (414) 5.7% 376,100 $ La Quinta 7.5% $ 212 2.8% $ 1,481 $ 1,646 $ 165 3.8% 302,000 $ Lake Elsinore 9.3% $ 154 7.2% $ 1,735 $ 1,341 $ (394) 5.5% 306,500 $ Menifee 7.3% $ 151 5.7% $ 1,606 $ 1,365 $ (241) 5.0% 262,000 $ Moreno Valley 7.6% $ 156 3.6% $ 1,556 $ 1,163 $ (393) 5.7% 356,100 $ Murrieta 7.3% $ 166 5.2% $ 1,839 $ 1,590 $ (249) 5.0% 462,600 $ Norco 6.7% $ 248 -1.7% $ 2,195 $ 2,047 $ (148) 4.6% 308,500 $ Palm Desert 5.5% $ 189 8.6% $ 1,557 $ 1,378 $ (179) 4.8% 323,100 $ Palm Springs 2.8% $ 233 5.9% $ 1,375 $ 1,405 $ 30 4.1% 246,300 $ Perris 7.4% $ 143 1.6% $ 1,443 $ 1,085 $ (359) 5.6% 394,100 $ Rancho Mirage -4.8% $ 198 -6.1% $ 2,013 $ 1,776 $ (237) 4.9% 330,400 $ Riverside 5.5% $ 200 2.1% $ 1,748 $ 1,456 $ (292) 5.1% 216,300 $ San Jacinto 7.2% $ 116 5.7% $ 1,434 $ 966 $ (467) 6.4% 197,600 $ Sun City 2.2% $ 141 0.1% $ 1,076 $ 872 $ (205) 5.2% 403,700 $ Temecula 5.0% $ 192 4.5% $ 2,003 $ 1,789 $ (214) 4.8% 308,200 $ Wildomar 10.9% $ 156 7.1% $ 1,785 $ 1,380 $ (405) 5.6% 202,600 $ Banning 92220 3.3% $ 142 6.4% $ 1,174 $ 905 $ (270) 5.6% 271,900 $ Beaumont 92223 6.4% $ 137 0.3% $ 1,698 $ 1,208 $ (490) 6.0% 350,800 $ Canyon Lake 92587 1.4% $ 185 2.3% $ 1,909 $ 1,557 $ (352) 5.2% 245,900 $ Cathedral City 92234 2.4% $ 150 1.5% $ 1,600 $ 1,115 $ (486) 6.2% 415,600 $ Corona 92880 2.8% $ 207 11.8% $ 2,283 $ 1,851 $ (433) 5.3% 442,400 $ Corona 92881 3.6% $ 218 2.6% $ 2,228 $ 2,002 $ (226) 4.8% 402,200 $ Corona 92882 9.7% $ 237 2.4% $ 2,228 $ 1,800 $ (428) 5.3% 409,500 $ Corona 92883 3.7% $ 198 2.6% $ 2,225 $ 1,829 $ (396) 5.2% 159,900 $ Desert Hot Springs 92240 12.2% $ 103 10.6% $ 1,004 $ 712 $ (292) 6.0% 201,000 $ Hemet 92544 7.0% $ 120 5.9% $ 1,214 $ 898 $ (316) 5.8% 219,700 $ Hemet 92545 7.8% $ 119 7.2% $ 1,315 $ 978 $ (336) 5.7% 229,800 $ Indio 92201 8.5% $ 145 -1.4% $ 1,433 $ 1,048 $ (385) 6.0% 289,300 $ Indio 92203 2.8% $ 151 2.5% $ 1,759 $ 1,283 $ (477) 5.8% 376,900 $ La Quinta 92253 7.5% $ 212 2.8% $ 1,481 $ 1,649 $ 168 3.8% 36 of 58 OC Housing News info@ochousingnews.com Shevy Akason 877-409-8515 January 2016
Market Performance and Trends: Riverside County, Major Cities, and ZipsMarket Performance and Trends: Riverside County, Major Cities, and Zips Median Resale $ Resale % Change YoY Resale $/SF Change YoY Rent % Median Rent $ Cost of Ownership Ownership Prem./Disc. Cap Rate City Lake Elsinore 92530 279,600 $ 8.2% $ 161 8.5% $ 1,393 $ 1,233 $ (159) 4.8% 317,600 $ Menifee 92584 7.0% $ 151 2.9% $ 1,757 $ 1,416 $ (341) 5.3% 250,800 $ Moreno Valley 92551 7.2% $ 151 10.0% $ 1,388 $ 1,115 $ (273) 5.3% 239,500 $ Moreno Valley 92553 8.9% $ 167 5.7% $ 1,416 $ 1,059 $ (357) 5.7% 301,800 $ Moreno Valley 92555 2.3% $ 135 2.8% $ 1,700 $ 1,336 $ (364) 5.4% 276,200 $ Moreno Valley 92557 11.5% $ 165 0.6% $ 1,532 $ 1,226 $ (306) 5.3% 358,700 $ Murrieta 92562 7.0% $ 179 4.5% $ 1,892 $ 1,606 $ (285) 5.1% 353,200 $ Murrieta 92563 7.9% $ 155 6.3% $ 1,790 $ 1,564 $ (226) 4.9% 462,600 $ Norco 92860 6.7% $ 248 -1.7% $ 2,195 $ 2,047 $ (148) 4.6% 307,400 $ Palm Desert 92211 4.5% $ 182 2.5% $ 1,659 $ 1,381 $ (279) 5.2% 307,700 $ Palm Desert 92260 6.9% $ 198 16.4% $ 1,475 $ 1,382 $ (92) 4.6% 330,500 $ Palm Springs 92262 1.8% $ 242 12.0% $ 1,618 $ 1,444 $ (173) 4.7% 315,900 $ Palm Springs 92264 3.4% $ 222 -2.2% $ 1,434 $ 1,404 $ (29) 4.4% 247,700 $ Perris 92571 3.7% $ 142 2.5% $ 1,456 $ 1,090 $ (366) 5.6% 394,100 $ Rancho Mirage 92270 -4.9% $ 198 -6.0% $ 2,013 $ 1,776 $ (237) 4.9% 330,900 $ Riverside 92503 5.8% $ 203 1.1% $ 1,731 $ 1,448 $ (283) 5.0% 297,400 $ Riverside 92504 8.8% $ 205 8.6% $ 1,559 $ 1,319 $ (240) 5.0% 361,800 $ Riverside 92506 7.2% $ 219 8.1% $ 1,629 $ 1,620 $ (8) 4.3% 280,700 $ Riverside 92507 5.1% $ 195 3.6% $ 1,375 $ 1,233 $ (142) 4.7% 414,800 $ Riverside 92508 3.6% $ 176 -3.7% $ 1,973 $ 1,838 $ (135) 4.6% 201,200 $ San Jacinto 92583 9.1% $ 122 5.7% $ 1,302 $ 905 $ (397) 6.2% 183,200 $ Sun City 92586 1.1% $ 139 5.2% $ 1,085 $ 814 $ (270) 5.7% 403,600 $ Temecula 92592 5.5% $ 193 3.9% $ 1,993 $ 1,789 $ (204) 4.7% 309,300 $ Wildomar 92595 11.2% $ 156 6.5% $ 1,740 $ 1,384 $ (356) 5.4% 37 of 58 OC Housing News info@ochousingnews.com Shevy Akason 877-409-8515 January 2016
Market Timing Rating and Valuations: Riverside County, Major Cities, and ZipsMarket Timing Rating and Valuations: Riverside County, Major Cities, and Zips % Over/Under Historic Premium % Over/Under Historic Prem. Median Rental Parity Rental Parity Rating City Banning $ 202,600 397,300 $ 9 -14.6% -24.1% -9.5% $ 272,000 378,800 $ Beaumont 6 -31.6% -28.7% 2.9% $ 249,100 355,200 $ Cathedral City 7 -18.0% -27.7% -9.7% $ 406,500 478,400 $ Corona 8 -19.4% -15.7% 3.7% $ 160,500 215,600 $ Desert Hot Springs 6 -26.9% -25.1% 1.8% $ 194,100 268,500 $ Hemet 7 -20.2% -27.5% -7.3% $ 271,100 360,300 $ Indio 8 -31.2% -24.6% 6.6% $ 376,100 330,300 $ La Quinta 6 -3.5% 10.5% 14.1% $ 302,000 387,000 $ Lake Elsinore 6 -27.4% -23.7% 3.7% $ 306,500 358,200 $ Menifee 8 -7.0% -15.1% -8.1% $ 262,000 347,200 $ Moreno Valley 7 -18.4% -25.2% -6.8% $ 356,100 410,200 $ Murrieta 8 -3.9% -14.0% -10.1% $ 462,600 489,700 $ Norco 5 -7.6% -5.1% 2.5% $ 308,500 347,400 $ Palm Desert 10 14.9% -11.0% -25.9% $ 323,100 306,700 $ Palm Springs 7 -11.1% 2.6% 13.7% $ 246,300 322,000 $ Perris 5 -26.8% -25.2% 1.6% $ 394,100 449,000 $ Rancho Mirage 6 21.3% -11.8% -33.1% $ 330,400 390,000 $ Riverside 8 -20.4% -16.5% 3.9% $ 216,300 319,900 $ San Jacinto 8 -23.5% -31.8% -8.2% $ 197,600 240,100 $ Sun City 7 -4.0% -17.2% -13.2% $ 403,700 446,800 $ Temecula 8 -9.2% -12.3% -23.0% -3.1% -17.5% $ 308,200 398,100 $ Wildomar 8 -5.5% $ 202,600 262,000 $ Banning 92220 9 -13.9% -24.1% -10.2% $ 271,900 378,800 $ Beaumont 92223 6 -33.6% -28.7% 4.9% $ 350,800 425,900 $ Canyon Lake 92587 9 5.9% -18.7% -24.5% $ 245,900 357,000 $ Cathedral City 92234 7 -20.1% -29.1% -9.1% $ 415,600 509,400 $ Corona 92880 7 -19.9% -18.5% 1.4% $ 442,400 497,000 $ Corona 92881 8 -10.2% -10.3% -0.1% $ 402,200 496,900 $ Corona 92882 7 -10.2% -17.3% -7.1% $ 409,500 496,400 $ Corona 92883 8 -22.0% -17.8% 4.2% $ 159,900 224,000 $ Desert Hot Springs 92240 7 -19.1% -30.5% -11.3% $ 201,000 270,800 $ Hemet 92544 10 -1.9% -24.5% -22.7% $ 219,700 293,300 $ Hemet 92545 6 -20.5% -25.6% -5.1% $ 229,800 319,600 $ Indio 92201 4 -30.5% -27.2% 3.3% $ 289,300 392,500 $ Indio 92203 10 -4.1% -27.1% -23.0% $ 376,900 330,300 $ La Quinta 92253 5 -8.2% 10.7% 18.9% 38 of 58 OC Housing News info@ochousingnews.com Shevy Akason 877-409-8515 January 2016
Market Timing Rating and Valuations: Riverside County, Major Cities, and ZipsMarket Timing Rating and Valuations: Riverside County, Major Cities, and Zips % Over/Under Historic Premium % Over/Under Historic Prem. Median Rental Parity Rental Parity Rating City $ 279,600 310,600 $ Lake Elsinore 92530 6 -18.2% -15.9% 2.3% $ 317,600 391,900 $ Menifee 92584 8 -10.1% -18.9% -8.8% $ 250,800 309,500 $ Moreno Valley 92551 6 -14.6% -20.6% -6.0% $ 239,500 315,800 $ Moreno Valley 92553 7 -22.3% -25.9% -3.6% $ 301,800 379,200 $ Moreno Valley 92555 9 -5.7% -20.6% -14.9% $ 276,200 341,800 $ Moreno Valley 92557 6 -11.0% -19.8% -8.8% $ 358,700 422,000 $ Murrieta 92562 9 0.3% -15.1% -15.3% $ 353,200 399,200 $ Murrieta 92563 7 -6.3% -13.3% -7.1% $ 462,600 489,700 $ Norco 92860 5 -7.6% -5.1% 2.5% $ 307,400 370,200 $ Palm Desert 92211 10 22.5% -16.4% -38.9% $ 307,700 328,900 $ Palm Desert 92260 8 9.8% -4.4% -14.3% $ 330,500 360,800 $ Palm Springs 92262 4 -17.9% -8.7% 9.2% $ 315,900 319,800 $ Palm Springs 92264 4 -1.7% -4.2% -2.4% $ 247,700 324,800 $ Perris 92571 8 -29.5% -25.5% 4.0% $ 394,100 449,000 $ Rancho Mirage 92270 4 8.0% -11.8% -19.8% $ 330,900 386,000 $ Riverside 92503 6 -23.0% -17.3% 5.7% $ 297,400 347,700 $ Riverside 92504 5 -24.5% -14.5% 10.0% $ 361,800 363,300 $ Riverside 92506 6 0.0% -2.1% -2.2% $ 280,700 306,700 $ Riverside 92507 8 -18.5% -11.2% 7.3% $ 414,800 440,100 $ Riverside 92508 3 -16.9% -6.3% 10.5% $ 201,200 290,500 $ San Jacinto 92583 8 -17.7% -31.1% -13.5% $ 183,200 242,000 $ Sun City 92586 8 -4.1% -23.3% -19.1% $ 403,600 444,700 $ Temecula 92592 8 -10.4% -10.5% -0.1% $ 309,300 388,200 $ Wildomar 92595 9 -5.5% -21.6% -16.1% 39 of 58 OC Housing News info@ochousingnews.com Shevy Akason 877-409-8515 January 2016
San Bernardino County Housing Market News Historically, properties in this market sell at a 25.7% discount. Today's discount is 32.2%. This market is 6.6% undervalued. Median home price is $280,200 with a rental parity value of $406,600. This market's discount is $126,400. Monthly payment affordability has been worsening over the last 1 month(s). Momentum suggests unchanging affordability. Resale prices on a $/SF basis increased from $184/SF to $184/SF. Resale prices have been rising for 1 month(s). Over the last 12 months, resale prices rose 7.0% indicating a longer term upward price trend. Median rental rates declined $23 last month from $1,845 to $1,822. The current capitalization rate (rent/price) is 6.2%. Rents have been rising for 12 month(s). Price momentum signals rising rents over the next three months. Market rating = 8 Median Home Price and Rental Parity trailing twelve months Date Rating Median Rental Parity Historic Value 1/2015 9 258,700 $ 400,900 $ 2/2015 9 258,200 $ 402,800 $ 3/2015 9 261,100 $ 400,100 $ 4/2015 9 263,500 $ 407,700 $ 5/2015 9 267,300 $ 407,200 $ 6/2015 9 268,800 $ 406,900 $ 7/2015 8 274,600 $ 407,100 $ 8/2015 7 278,000 $ 417,600 $ 9/2015 8 278,800 $ 418,700 $ 10/2015 7 281,000 $ 422,300 $ 11/2015 8 280,100 $ 412,800 $ 12/2015 8 280,200 $ 406,600 $ $500,000 297,987 $ 299,399 $ 297,392 $ 303,041 $ 302,670 $ 302,447 $ 302,595 $ 310,400 $ 311,218 $ 313,893 $ 306,832 $ 302,224 $ $400,000 $300,000 $200,000 $100,000 Median Rental Parity Historic Value $- 1/2015 2/2015 3/2015 4/2015 5/2015 6/2015 7/2015 8/2015 9/2015 10/2015 11/2015 12/2015 Resale $/SF and year-over-year percentage change trailing twelve months Date ± Typ. Value $/SF % Change 1/2015 -8.7% 171 $ 5.8% 2/2015 -9.5% 171 $ 4.5% 3/2015 -9.7% 172 $ 4.6% 4/2015 -9.7% 173 $ 4.4% 5/2015 -9.2% 174 $ 3.9% 6/2015 -8.9% 176 $ 3.8% 7/2015 -7.9% 179 $ 6.3% 8/2015 -7.6% 181 $ 7.0% 9/2015 -7.5% 183 $ 6.9% 10/2015 -7.8% 184 $ 7.1% 11/2015 -7.3% 184 $ 6.6% 12/2015 -6.6% 184 $ 7.0% $190 $179 $181 $183 $184 $184 $184 $185 $180 $171 $171 $172 $173 $174 $176 $175 $170 $165 $160 1/2015 2/2015 3/2015 4/2015 5/2015 6/2015 7/2015 8/2015 9/2015 10/2015 11/2015 12/2015 -0.2567051 Rental rate and year-over-year percentage change trailing twelve months Date % Change Rent Own Historic Cost to Own Relative to Rent 1/2015 4.5% 1,743 $ 1,148 $ $ 2/2015 4.7% 1,752 $ 1,134 $ $ 3/2015 4.7% 1,752 $ 1,130 $ $ 4/2015 4.8% 1,764 $ 1,135 $ $ 5/2015 5.1% 1,799 $ 1,155 $ $ 6/2015 5.0% 1,828 $ 1,176 $ $ 7/2015 5.0% 1,845 $ 1,211 $ $ 8/2015 4.8% 1,861 $ 1,230 $ $ 9/2015 4.8% 1,861 $ 1,241 $ $ 10/2015 4.5% 1,857 $ 1,238 $ $ 11/2015 4.1% 1,846 $ 1,242 $ $ 12/2015 4.0% 1,823 $ 1,248 $ $ $1,743 $1,752 $1,752 $1,764 $1,799 $1,828 $1,845 $1,861 $1,861 $1,857 $1,846 $1,823 $2,000 1,296 1,302 1,303 1,311 1,337 1,359 1,371 1,383 1,383 1,380 1,372 1,355 $1,800 $1,600 $1,400 $1,200 $1,000 Rent Own Historic Cost to Own Relagve to Rent $800 1/2015 2/2015 3/2015 4/2015 5/2015 6/2015 7/2015 8/2015 9/2015 10/2015 11/2015 12/2015 40 of 58 OC Housing News info@ochousingnews.com Shevy Akason 877-409-8515 January 2016
San Bernardino County median home price since January 1988 $450,000 Median Resale Rental Parity Historic Value Projecgon $400,000 $350,000 $300,000 $250,000 $200,000 $150,000 $100,000 $50,000 $0 1/1988 1/1989 1/1990 1/1991 1/1992 1/1993 1/1995 1/1996 1/1998 1/1999 1/2000 1/2001 1/2002 1/2003 1/2005 1/2006 1/2008 1/2009 1/2010 1/2011 1/2012 1/2013 1/2015 1/2016 1/1994 1/1997 1/2004 1/2007 1/2014 1/2017 San Bernardino County median rent and monthly cost of ownership since January 1988 Median Rent Cost to Own Historic Cost to Own Relagve to Rent $2,500 $2,000 $1,500 $1,000 $500 $0 Date 12/1988 12/1989 12/1990 12/1991 12/1992 12/1993 12/1994 12/1995 12/1996 12/1997 12/1998 12/1999 12/2000 12/2001 12/2002 12/2003 12/2004 12/2005 12/2006 12/2007 12/2008 12/2009 12/2010 12/2011 12/2012 12/2013 12/2014 12/2015 12/2016 41 of 58 OC Housing News info@ochousingnews.com Shevy Akason 877-409-8515 January 2016
Resale $/SF Year-over-Year Percentage Change: San Bernardino County since January 1989Resale $/SF Year-over-Year Percentage Change: San Bernardino County since January 1989 50% 45% Appreciagon rates in excess of 7% are not sustainable. Long periods of excessive appreciagon lead to a crash. 40% 35% 30% 25% 20% 15% 10% 5% Normal and sustainable 0% -5% -10% -15% Falling/Correcgng -20% -25% -30% -35% -40% -45% -50% 1/1989 1/1990 1/1995 1/1996 1/1998 1/1999 1/2000 1/2005 1/2006 1/2008 1/2009 1/2010 1/2015 1/1991 1/1992 1/1993 1/1994 1/1997 1/2001 1/2002 1/2003 1/2004 1/2007 1/2011 1/2012 1/2013 1/2014 Rental $/SF Year-over-Year Percentage Change: San Bernardino County since January 1989 18% 16% Rental rates in excess of 7% are not sustainable. Long periods of excessive appreciagon lead to a crash. 14% 12% 10% 8% Normal and sustainable 6% 4% 2% Weak 0% -2% Falling/Correcgng -4% -6% -8% 1/1989 1/1990 1/1991 1/1992 1/1993 1/1994 1/1995 1/1996 1/1997 1/1998 1/1999 1/2000 1/2001 1/2002 1/2003 1/2004 1/2005 1/2006 1/2007 1/2008 1/2009 1/2010 1/2011 1/2012 1/2013 1/2014 1/2015 42 of 58 OC Housing News info@ochousingnews.com Shevy Akason 877-409-8515 January 2016
Historic Median Home Price Relative to Rental Parity: San Bernardino County since January 1988Historic Median Home Price Relative to Rental Parity: San Bernardino County since January 1988 Value Relagve to Rental Parity Historic Norm 84.0% 77.0% Stable period between housing bubbles from 1993-1999 establishes historic norm. 70.0% 63.0% 56.0% 49.0% 42.0% 35.0% Discount or Premium 28.0% 21.0% 14.0% 7.0% 0.0% -7.0% -14.0% -21.0% -28.0% -35.0% -42.0% -49.0% -56.0% -63.0% -70.0% 1/1989 1/1990 1/1991 1/1992 1/1993 1/1995 1/1996 1/1998 1/1999 1/2000 1/2001 1/2002 1/2003 1/2005 1/2006 1/2008 1/2009 1/2010 1/2011 1/2012 1/2013 1/2015 1/2016 1/1994 1/1997 1/2004 1/2007 1/2014 1/2017 OCHN Market Timing System Rating: San Bernardino County since January 1988 10 9 Values 7-10: Undervalued Market: Strong Buy Recommendagon 8 7 6 Values 4-6: Neutral Market, Weak Buy Recommendagon 5 4 3 Values 1-3: Inflated or Weak Market: Consider Selling. Do not Buy. 2 1 0 1/1988 1/1989 1/1990 1/1991 1/1992 1/1993 1/1994 1/1995 1/1996 1/1997 1/1998 1/1999 1/2000 1/2001 1/2002 1/2003 1/2004 1/2005 1/2006 1/2007 1/2008 1/2009 1/2010 1/2011 1/2012 1/2013 1/2014 1/2015 1/2016 43 of 58 OC Housing News info@ochousingnews.com Shevy Akason 877-409-8515 January 2016
Cash Investor Capitalization Rate: San Bernardino County since January 1988Cash Investor Capitalization Rate: San Bernardino County since January 1988 Capitalizagon Rate Mortgage Interest Rate 14.0% 12.0% 10.0% 8.0% 6.0% 4.0% 2.0% 0.0% 1/1988 1/1989 1/1990 1/1991 1/1992 1/1993 1/1995 1/1996 1/1998 1/1999 1/2000 1/2001 1/2002 1/2003 1/2005 1/2006 1/2008 1/2009 1/2010 1/2011 1/2012 1/2013 1/2015 1/2016 1/1994 1/1997 1/2004 1/2007 1/2014 1/2017 Financed Investor Cash-on-Cash Return: San Bernardino County since January 1988 50.0% 40.0% 30.0% 20.0% 10.0% 0.0% -10.0% -20.0% -30.0% 1/1988 1/1989 1/1990 1/1991 1/1992 1/1993 1/1995 1/1996 1/1998 1/1999 1/2000 1/2001 1/2002 1/2003 1/2005 1/2006 1/2008 1/2009 1/2010 1/2011 1/2012 1/2013 1/2015 1/2016 1/1994 1/1997 1/2004 1/2007 1/2014 1/2017 44 of 58 OC Housing News info@ochousingnews.com Shevy Akason 877-409-8515 January 2016
Market Performance and Trends: San Bernardino County, Major Cities, and ZipsMarket Performance and Trends: San Bernardino County, Major Cities, and Zips Median Resale $ Resale % Change YoY Resale $/SF Change YoY Rent % Median Rent $ Cost of Ownership Ownership Prem./Disc. Cap Rate City Adelanto 155,800 $ 6.7% $ 98 11.7% $ 1,056 $ 695 $ (361) 6.5% 193,200 $ Apple Valley 1.7% $ 110 3.5% $ 968 $ 860 $ (107) 4.8% 417,100 $ Chino 5.6% $ 238 5.3% $ 2,106 $ 1,832 $ (274) 4.8% 533,000 $ Chino Hills 6.0% $ 308 -0.2% $ 2,289 $ 2,397 $ 108 4.1% 222,600 $ Colton 8.6% $ 173 3.2% $ 1,242 $ 981 $ (261) 5.4% 331,600 $ Fontana 6.9% $ 195 0.6% $ 2,041 $ 1,477 $ (564) 5.9% 214,300 $ Hesperia 4.6% $ 116 3.4% $ 1,240 $ 953 $ (287) 5.6% 274,900 $ Highland 12.7% $ 167 -0.4% $ 1,670 $ 1,196 $ (475) 5.8% 121,300 $ Joshua Tree 6.9% $ 95 -5.9% $ 824 $ 531 $ (294) 6.5% 332,500 $ Loma Linda 0.0% $ 153 -0.1% $ 1,620 $ 1,479 $ (141) 4.7% 345,800 $ Montclair 8.1% $ 244 0.1% $ 1,656 $ 1,535 $ (121) 4.6% 341,500 $ Ontario 10.0% $ 245 0.6% $ 1,803 $ 1,509 $ (293) 5.1% 420,700 $ Rancho Cucamonga 5.0% $ 248 0.8% $ 2,108 $ 1,864 $ (245) 4.8% 330,800 $ Redlands 8.3% $ 210 4.9% $ 1,711 $ 1,482 $ (229) 5.0% 280,800 $ Rialto 8.2% $ 180 5.7% $ 1,536 $ 1,245 $ (291) 5.3% 214,100 $ San Bernardino (City) 10.2% $ 159 2.1% $ 1,366 $ 943 $ (423) 6.1% $ 71,200 Twentynine Palms -7.4% $ 68 -13.3% $ 828 $ 319 $ (509) 11.2% 466,600 $ Upland 4.6% $ 262 10.2% $ 2,040 $ 2,119 $ 78 4.2% 195,100 $ Victorville 7.1% $ 106 3.7% $ 1,274 $ 873 $ (402) 6.3% 310,000 $ Yucaipa 7.2% $ 177 8.8% $ 1,337 $ 1,371 $ 34 4.1% 45 of 58 OC Housing News info@ochousingnews.com Shevy Akason 877-409-8515 January 2016
Market Performance and Trends: San Bernardino County, Major Cities, and ZipsMarket Performance and Trends: San Bernardino County, Major Cities, and Zips Median Resale $ Resale % Change YoY Resale $/SF Change YoY Rent % Median Rent $ Cost of Ownership Ownership Prem./Disc. Cap Rate City Chino 91710 420,400 $ 6.0% $ 246 6.7% $ 2,047 $ 1,843 $ (205) 4.7% 388,300 $ Fontana 92336 5.4% $ 190 0.8% $ 2,172 $ 1,723 $ (449) 5.4% 316,800 $ Fontana 92337 2.9% $ 195 -2.0% $ 1,740 $ 1,416 $ (324) 5.3% 286,200 $ Grand Terrace 92313 11.7% $ 187 6.4% $ 1,520 $ 1,284 $ (235) 5.1% 225,900 $ Hesperia 92344 1.7% $ 106 4.1% $ 1,290 $ 1,014 $ (276) 5.5% 321,200 $ Mentone 92359 6.6% $ 156 1.0% $ 1,195 $ 1,409 $ 214 3.6% 340,600 $ Ontario 91762 10.3% $ 244 -3.8% $ 1,471 $ 1,501 $ 30 4.1% Rancho Cucamonga 91701 437,800 $ 5.0% $ 252 1.3% $ 2,036 $ 1,957 $ (79) 4.5% Rancho Cucamonga 91730 353,800 $ 7.2% $ 247 2.5% $ 1,890 $ 1,585 $ (306) 5.1% Rancho Cucamonga 91737 467,500 $ -0.6% $ 252 3.1% $ 2,116 $ 2,094 $ (21) 4.3% Rancho Cucamonga 91739 570,100 $ 4.2% $ 246 -2.6% $ 2,626 $ 2,510 $ (116) 4.4% 384,600 $ Redlands 92373 12.5% $ 235 2.1% $ 1,929 $ 1,743 $ (187) 4.8% 263,300 $ Rialto 92376 7.7% $ 177 3.7% $ 1,478 $ 1,174 $ (304) 5.4% 336,100 $ Rialto 92377 10.2% $ 190 14.2% $ 1,822 $ 1,479 $ (343) 5.2% San Bernardino (City) 92405 200,100 $ 13.6% $ 159 10.9% $ 1,221 $ 890 $ (331) 5.9% San Bernardino (City) 92410 161,900 $ 5.0% $ 149 6.4% $ 1,010 $ 707 $ (302) 6.0% 579,900 $ Upland 91784 4.7% $ 258 7.4% $ 2,344 $ 2,602 $ 257 3.9% 390,500 $ Upland 91786 5.6% $ 267 10.4% $ 1,824 $ 1,766 $ (58) 4.5% 199,200 $ Victorville 92392 9.0% $ 105 4.5% $ 1,246 $ 893 $ (354) 6.0% 187,300 $ Victorville 92394 2.0% $ 101 1.6% $ 1,268 $ 840 $ (428) 6.5% 191,000 $ Victorville 92395 9.4% $ 113 4.0% $ 1,205 $ 846 $ (359) 6.1% 46 of 58 OC Housing News info@ochousingnews.com Shevy Akason 877-409-8515 January 2016
Market Timing Rating and Valuations: San Bernardino County, Major Cities, and ZipsMarket Timing Rating and Valuations: San Bernardino County, Major Cities, and Zips % Over/Under Historic Premium % Over/Under Historic Prem. Median Rental Parity Rental Parity Rating City Adelanto $ 155,800 235,600 $ 10 -3.8% -33.6% -29.8% $ 193,200 215,900 $ Apple Valley 8 9.7% -11.0% -20.7% $ 417,100 469,700 $ Chino 8 -9.0% -13.3% -4.3% $ 533,000 510,600 $ Chino Hills 5 6.6% 4.5% -2.1% $ 222,600 277,000 $ Colton 8 -10.7% -21.2% -10.5% $ 331,600 455,300 $ Fontana 6 -33.7% -28.0% 5.7% $ 214,300 276,700 $ Hesperia 8 -21.2% -24.0% -2.8% $ 274,900 372,600 $ Highland 6 -11.9% -28.6% -16.7% $ 121,300 183,900 $ Joshua Tree 5 -20.0% -35.4% -15.4% $ 332,500 361,400 $ Loma Linda 8 34.8% -8.7% -43.5% $ 345,800 369,500 $ Montclair 5 -6.0% -5.6% 0.4% $ 341,500 402,100 $ Ontario 6 -3.9% -15.5% -11.6% $ 420,700 470,300 $ Rancho Cucamonga 6 -7.6% -12.1% -4.4% $ 330,800 381,700 $ Redlands 8 -0.2% -12.0% -11.8% $ 280,800 342,700 $ Rialto 7 -22.8% -19.8% 3.0% $ 214,100 304,700 $ San Bernardino (City) 7 -28.5% -28.8% -0.3% $ 71,200 184,700 $ Twentynine Palms 4 -28.7% -60.6% -31.9% $ 466,600 455,200 $ Upland 7 6.9% 2.7% -4.1% $ 195,100 284,200 $ Victorville 10 -6.4% -30.8% -24.4% $ 310,000 298,200 $ Yucaipa 5 -9.2% 0.2% 9.4% 47 of 58 OC Housing News info@ochousingnews.com Shevy Akason 877-409-8515 January 2016
Market Timing Rating and Valuations: San Bernardino County, Major Cities, and ZipsMarket Timing Rating and Valuations: San Bernardino County, Major Cities, and Zips % Over/Under Historic Premium % Over/Under Historic Prem. Median Rental Parity Rental Parity Rating City $ 420,400 456,700 $ Chino 91710 8 -7.4% -10.9% -3.4% $ 388,300 484,600 $ Fontana 92336 5 -33.2% -20.6% 12.6% $ 316,800 388,200 $ Fontana 92337 5 -20.6% -18.8% 1.8% $ 286,200 339,000 $ Grand Terrace 92313 8 -7.2% -17.0% -9.8% $ 225,900 287,700 $ Hesperia 92344 7 -13.1% -21.5% -8.4% $ 321,200 266,600 $ Mentone 92359 7 28.1% 15.6% -12.4% $ 340,600 328,200 $ Ontario 91762 3 8.6% 2.0% -6.7% Rancho Cucamonga 91701 $ 437,800 454,200 $ 6 3.1% -2.7% -5.8% Rancho Cucamonga 91730 $ 353,800 421,700 $ 7 -14.6% -17.3% -2.7% Rancho Cucamonga 91737 $ 467,500 472,000 $ 9 23.9% -0.7% -24.6% Rancho Cucamonga 91739 $ 570,100 585,800 $ 3 -17.3% -4.4% 12.9% $ 384,600 430,400 $ Redlands 92373 10 20.5% -5.2% -25.7% $ 263,300 329,800 $ Rialto 92376 7 -22.1% -21.9% 0.3% $ 336,100 406,400 $ Rialto 92377 7 -8.2% -19.0% -10.8% San Bernardino (City) 92405 $ 200,100 272,300 $ 6 -18.6% -26.2% -7.7% San Bernardino (City) 92410 $ 161,900 225,200 $ 10 -1.5% -28.5% -27.0% $ 579,900 523,000 $ Upland 91784 7 10.9% 8.7% -2.2% $ 390,500 406,900 $ Upland 91786 8 8.5% -3.4% -11.9% $ 199,200 278,000 $ Victorville 92392 10 3.8% -28.8% -32.6% $ 187,300 282,900 $ Victorville 92394 8 -14.4% -32.9% -18.5% $ 191,000 268,700 $ Victorville 92395 9 -9.8% -30.0% -20.2% 48 of 58 OC Housing News info@ochousingnews.com Shevy Akason 877-409-8515 January 2016
Ventura County Housing Market News Historically, properties in this market sell at a 15.8% premium. Today's discount is 12.2%. This market is 28.0% undervalued. Median home price is $518,300 with a rental parity value of $583,000. This market's discount is $64,700. Monthly payment affordability has been improving over the last 9 month(s). Momentum suggests improving affordability. Resale prices on a $/SF basis increased from $320/SF to $322/SF. Resale prices have been rising for 1 month(s). Over the last 12 months, resale prices rose 8.9% indicating a longer term upward price trend. Median rental rates declined $32 last month from $2,645 to $2,613. The current capitalization rate (rent/price) is 4.8%. Rents have been rising for 12 month(s). Price momentum signals rising rents over the next three months. Market rating = 10 Median Home Price and Rental Parity trailing twelve months Date Rating Median Rental Parity Historic Value 1/2015 10 501,900 $ 558,500 $ 2/2015 10 506,100 $ 557,900 $ 3/2015 10 507,900 $ 557,600 $ 4/2015 10 513,800 $ 572,200 $ 5/2015 10 515,900 $ 577,200 $ 6/2015 10 522,600 $ 588,800 $ 7/2015 10 523,400 $ 583,900 $ 8/2015 10 523,400 $ 597,600 $ 9/2015 10 523,100 $ 591,500 $ 10/2015 10 521,900 $ 601,800 $ 11/2015 10 519,400 $ 591,600 $ 12/2015 10 518,300 $ 583,000 $ $800,000 646,955 $ 646,260 $ 645,913 $ 662,825 $ 668,617 $ 682,054 $ 676,378 $ 692,248 $ 685,182 $ 697,113 $ 685,297 $ 675,335 $ $600,000 $400,000 $200,000 Median Rental Parity Historic Value $- 1/2015 2/2015 3/2015 4/2015 5/2015 6/2015 7/2015 8/2015 9/2015 10/2015 11/2015 12/2015 Resale $/SF and year-over-year percentage change trailing twelve months Date ± Typ. Value $/SF % Change 1/2015 -26.0% 296 $ 2.3% 2/2015 -25.8% 297 $ 2.3% 3/2015 -25.3% 302 $ 3.8% 4/2015 -25.3% 307 $ 4.9% 5/2015 -25.8% 312 $ 6.0% 6/2015 -26.5% 317 $ 6.9% 7/2015 -26.6% 319 $ 6.5% 8/2015 -27.2% 320 $ 6.7% 9/2015 -27.3% 321 $ 7.0% 10/2015 -28.3% 321 $ 7.1% 11/2015 -28.2% 320 $ 7.3% 12/2015 -28.0% 322 $ 8.9% $317 $319 $320 $321 $321 $320 $322 $325 $320 $312 $315 $307 $310 $302 $305 $296 $297 $300 $295 $290 1/2015 2/2015 3/2015 4/2015 5/2015 6/2015 7/2015 8/2015 9/2015 10/2015 11/2015 12/2015 1/0/00 Rental rate and year-over-year percentage change trailing twelve months Date % Change Rent Own Historic Cost to Own Relative to Rent 1/2015 8.2% 2,428 $ 2,215 $ $ 2/2015 6.9% 2,426 $ 2,199 $ $ 3/2015 7.0% 2,443 $ 2,202 $ $ 4/2015 6.8% 2,476 $ 2,216 $ $ 5/2015 6.8% 2,550 $ 2,242 $ $ 6/2015 7.1% 2,646 $ 2,283 $ $ 7/2015 7.3% 2,646 $ 2,333 $ $ 8/2015 6.8% 2,663 $ 2,350 $ $ 9/2015 4.9% 2,629 $ 2,343 $ $ 10/2015 4.7% 2,646 $ 2,317 $ $ 11/2015 4.0% 2,646 $ 2,314 $ $ 12/2015 3.8% 2,613 $ 2,313 $ $ $3,400 $2,663 $2,646 $2,646 $2,646 $2,646 $2,629 $2,613 $2,550 2,813 2,810 2,829 2,868 2,954 3,065 3,065 3,084 3,045 3,064 3,064 3,027 $2,476 $2,443 $2,428 $2,426 $2,900 $2,400 $1,900 Rent Own Historic Cost to Own Relagve to Rent $1,400 1/2015 2/2015 3/2015 4/2015 5/2015 6/2015 7/2015 8/2015 9/2015 10/2015 11/2015 12/2015 49 of 58 OC Housing News info@ochousingnews.com Shevy Akason 877-409-8515 January 2016
Ventura County median home price since January 1988 $800,000 Median Resale Rental Parity Historic Value Projecgon $700,000 $600,000 $500,000 $400,000 $300,000 $200,000 $100,000 $0 1/1988 1/1989 1/1990 1/1991 1/1992 1/1993 1/1995 1/1996 1/1998 1/1999 1/2000 1/2001 1/2002 1/2003 1/2005 1/2006 1/2008 1/2009 1/2010 1/2011 1/2012 1/2013 1/2015 1/2016 1/1994 1/1997 1/2004 1/2007 1/2014 1/2017 Ventura County median rent and monthly cost of ownership since January 1988 Median Rent Cost to Own Historic Cost to Own Relagve to Rent $4,000 $3,500 $3,000 $2,500 $2,000 $1,500 $1,000 $500 $0 1/1988 1/1989 1/1990 1/1991 1/1992 1/1993 1/1995 1/1996 1/1998 1/1999 1/2000 1/2001 1/2002 1/2003 1/2005 1/2006 1/2008 1/2009 1/2010 1/2011 1/2012 1/2013 1/2015 1/2016 1/1994 1/1997 1/2004 1/2007 1/2014 1/2017 50 of 58 OC Housing News info@ochousingnews.com Shevy Akason 877-409-8515 January 2016