Download
1 / 30
310 likes | 391 Views
Conditioning of Image Reconstruction from Irregular Frequency Samples. Benjamin C. Lee Ph.D. Candidate, Electrical Engineering leebc@umich.edu University of Michigan, Ann Arbor, Michigan Dept. of Electrical Engineering and Computer Science Advisor: Andrew Yagle

E N D
Conditioning of Image Reconstruction from Irregular Frequency Samples Benjamin C. Lee Ph.D. Candidate, Electrical Engineering leebc@umich.edu University of Michigan, Ann Arbor, Michigan Dept. of Electrical Engineering and Computer Science Advisor: Andrew Yagle KSEA YGTLC, January 5-7, 2007
IntroductionImage Processing BasicsCurrent ResearchConclusion Image ReconstructionApplicationsComputed Tomography Example What is image reconstruction? • Process of transforming sensor data into a meaningful image of an object. Measurement Data Reconstructed Image Waves / Particles Object Sensor Computer Viewer Shapes: www.delta-education.com, Lens: www.luotain.uku.fi/~nissi, CCD: www.dalsa.com, Circuit: www.genusoverseas.com, Eye: www.phys.ufl.edu/~avery A Sensitivity Measure for Image Reconstruction from Irregular Frequency Samples
IntroductionImage Processing BasicsCurrent ResearchConclusion Image ReconstructionApplicationsComputed Tomography Example Why is image reconstruction necessary? • Object is inaccessible to image directly, like underground oil or inside of a cell. • Object cannot be cut open or destroyed, like a living person or a manufactured part. Oil: www.bgs.ac.uk, Lymphocyte Cell: www.itam.nsc.ru/lab17, Head: vis-www.cs.umass.edu/vislib, Engine: www.yxlon.com A Sensitivity Measure for Image Reconstruction from Irregular Frequency Samples
IntroductionImage Processing BasicsCurrent ResearchConclusion Image ReconstructionApplicationsComputed Tomography Example Spotlight-Mode Synthetic Aperture Radar • Ground patch is imaged with microwaves using a radar antenna mounted on an airplane. • Reflected radar of varying angles transformed into image through weather, darkness, and even foliage. Side View: www.ccrs.nrcan.gc.ca, Angled View: Munson, IEEE Trans ASSP, 1989 v37n12p2131, SAR Image: www.sandia.gov/radar A Sensitivity Measure for Image Reconstruction from Irregular Frequency Samples
IntroductionImage Processing BasicsCurrent ResearchConclusion Image ReconstructionApplicationsComputed Tomography Example Electron Tomography • Microorganisms or cells on slides are imaged with electrons using transmission electron microscope. • Many 2-D image projections of varying angles reconstruct into 3-D image volume and surfaces. Microscope: www.electronmicroscopy.nl, Slide: Sandberg, J Struct Bio, 144 (2003) 61-72, Pneumonia Cell: www-db.embl.de/jss/EmblGroupsOrg/g_247.html A Sensitivity Measure for Image Reconstruction from Irregular Frequency Samples
IntroductionImage Processing BasicsCurrent ResearchConclusion Image ReconstructionApplicationsComputed Tomography Example Magnetic Resonance Imaging (MRI) • Inside of human body is imaged with strong magnetic fields and a spinning magnetic field using magnetic coils. • Emitted oscillating magnetic fields transformed into cross-sectional image of organs by measuring water content. Machine: www.e-radiography.net, Coils: www.med.yale.edu/intmed/cardio/imaging, Image: www.lumen.luc.edu/lumen A Sensitivity Measure for Image Reconstruction from Irregular Frequency Samples
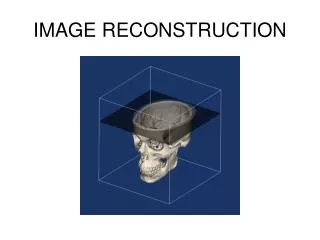
IntroductionImage Processing BasicsCurrent ResearchConclusion Image ReconstructionApplicationsComputed Tomography Example Computed Tomography (CT) • Inside of human body imaged with x-rays using a rotating x-ray emitter and detector array. • X-ray projections over all angles transformed into cross-sectional images of bone by measuring radio-density. Machine: www.e-radiography.net, XRay: www.imaginis.com, Image: www.lumen.luc.edu/lumen A Sensitivity Measure for Image Reconstruction from Irregular Frequency Samples
IntroductionImage Processing BasicsCurrent ResearchConclusion Image ReconstructionApplicationsComputed Tomography Example Data Acquisition • 1-D x-ray projections of radiographic attenuation are recorded per angle over 180 degrees. A Sensitivity Measure for Image Reconstruction from Irregular Frequency Samples
IntroductionImage Processing BasicsCurrent ResearchConclusion Image ReconstructionApplicationsComputed Tomography Example Filtering • Sharpening the projections, or more precisely applying a windowed ramp filter, corrects for any unwanted overlapping and blurriness in the final image. A Sensitivity Measure for Image Reconstruction from Irregular Frequency Samples
IntroductionImage Processing BasicsCurrent ResearchConclusion Image ReconstructionApplicationsComputed Tomography Example Back Projection • Image can be reconstructed by back-projecting or “smearing” and summing all filtered projections. A Sensitivity Measure for Image Reconstruction from Irregular Frequency Samples
IntroductionImage Processing BasicsCurrent ResearchConclusion Image ReconstructionApplicationsComputed Tomography Example Filtered Back Projection • Reconstruction of an actual head by back-projecting each filtered projection incrementally. Static Image: www.lumen.luc.edu/lumen A Sensitivity Measure for Image Reconstruction from Irregular Frequency Samples
IntroductionImage Processing BasicsCurrent ResearchConclusion Image ReconstructionApplicationsComputed Tomography Example 3D Volume Reconstruction • Multiple image slices are reconstructed, stacked in sequence, and surfaces are generated. • Filtered back projection is only an approximation. • Are there any other methods to reconstruct an image slice from projection data? • Yes Transverse: www.lumen.luc.edu/lumen, Sagittal: vis-www.cs.umass.edu/vislib, 3D: www.grani.ru A Sensitivity Measure for Image Reconstruction from Irregular Frequency Samples
IntroductionImage Processing BasicsCurrent ResearchConclusion 1-D Fourier Series1-D Fourier Transform2-D Fourier TransformProjection-Slice Theorem 1-D Signal Processing • Any function or signal can be constructed from a sum of sinusoids, called the Fourier Series. Sum Signal Sinusoid Amplitude Frequency Phase Ak k 1/fk A Sensitivity Measure for Image Reconstruction from Irregular Frequency Samples
IntroductionImage Processing BasicsCurrent ResearchConclusion 1-D Fourier Series1-D Fourier Transform2-D Fourier TransformProjection-Slice Theorem Square Wave Estimate • Sum of 3 cosines and Fourier series coefficients Ak • Sum of 100 cosines and Fourier series coefficients Ak Low Frequency High Frequency A Sensitivity Measure for Image Reconstruction from Irregular Frequency Samples
IntroductionImage Processing BasicsCurrent ResearchConclusion 1-D Fourier Series1-D Fourier Transform2-D Fourier TransformProjection-Slice Theorem 1-D Fourier Transform • Discrete frequencies of Fourier Series are generalized to continuous frequencies of Fourier Transform. • Fourier Transform and Inverse Fourier Transform convert between original function and frequency representation. Fourier Series (discrete frequencies) Fourier Transform (continuous frequencies) Frequency Representation Original Function Inverse Fourier Transform Fourier Transform A Sensitivity Measure for Image Reconstruction from Irregular Frequency Samples
IntroductionImage Processing BasicsCurrent ResearchConclusion 1-D Fourier Series1-D Fourier Transform2-D Fourier TransformProjection-Slice Theorem Box Function Estimate • In 2-D, any function or surface can be constructed from a sum of sinusoidal wave fields. 1st Harmonics 3rd Harmonics 15th Harmonics 5th Harmonics A Sensitivity Measure for Image Reconstruction from Irregular Frequency Samples
IntroductionImage Processing BasicsCurrent ResearchConclusion 1-D Fourier Series1-D Fourier Transform2-D Fourier TransformProjection-Slice Theorem 2-D Fourier Transform • Images can also be seen as 2-D functions. • 2-D Fourier Transform of above image. Image Intensities Light Dark Frequency Content High Frequency Low Frequency Head: www.lumen.luc.edu/lumen A Sensitivity Measure for Image Reconstruction from Irregular Frequency Samples
IntroductionImage Processing BasicsCurrent ResearchConclusion 1-D Fourier Series1-D Fourier Transform2-D Fourier TransformProjection-Slice Theorem Projection-Slice Theorem • Fourier Transform of a 1-D projection of an image is equal to the slice of a 2-D Fourier Transform of the same image. Projection Slice 1-D Fourier Transform 2-D Fourier Transform Head: www.lumen.luc.edu/lumen A Sensitivity Measure for Image Reconstruction from Irregular Frequency Samples
IntroductionImage Processing BasicsCurrent ResearchConclusion 1-D Fourier Series1-D Fourier Transform2-D Fourier TransformProjection-Slice Theorem Fourier Inversion Reconstruction • Interpolate frequency values over whole grid from slices, then take inverse 2-D Fourier transform. • But once again this is still an approximation. Is there an exact solution? • Yes Interpolation Inverse Fourier Transform Projection Head: www.lumen.luc.edu/lumen A Sensitivity Measure for Image Reconstruction from Irregular Frequency Samples
IntroductionImage Processing BasicsCurrent ResearchConclusion Problem StatementUnwrapping from 2-D to 1-DSensitivity MeasureNumerical Results System of Linear Equations • Why not solve as large system of linear equations? • This is an exact solution, but uniqueness (how many sufficient frequencies) and conditioning (stability), which is determined by which frequencies, are unclear in 2-D. Ax=b System Matrix (Frequency Locations) Solution (Image) Data (Frequency Values) A Sensitivity Measure for Image Reconstruction from Irregular Frequency Samples
IntroductionImage Processing BasicsCurrent ResearchConclusion Problem StatementUnwrapping from 2-D to 1-DSensitivity MeasureNumerical Results Conditioning • … is sensitivity of solution to perturbations in data. • In the real world, noise exists in all measurement data. • Noise in the frequency data is amplified in reconstructed image. • Condition number of system matrix determines noise amplification. • Conditioning is determined by choice of frequency locations used in the system matrix. Noise (δ) Freq. Config. (A) Solution (x) Freq. Data (b) Amp. Noise (ε) Noisy Sol’n (x+ε) Head: www.lumen.luc.edu/lumen A Sensitivity Measure for Image Reconstruction from Irregular Frequency Samples
IntroductionImage Processing BasicsCurrent ResearchConclusion Problem StatementUnwrapping from 2-D to 1-DSensitivity MeasureNumerical Results Problem Statement • Our goal is to answer how we: • Reconstruct the exact image without approximations? • Develop a fast method to find the configuration of frequency data with the best conditioning (least amplification of noise)? A Sensitivity Measure for Image Reconstruction from Irregular Frequency Samples
IntroductionImage Processing BasicsCurrent ResearchConclusion Problem StatementUnwrapping from 2-D to 1-DSensitivity MeasureNumerical Results Kronecker Substitution • 2-D problem is unwrapped into 1-D • Image of size M has rotated 45° support and is unwrapped by • 2-D Fourier Transform values are unwrapped as • Now we can solve better understood 1-D system of linear equations. Rotated Image Diagonal Frequency Lines A Sensitivity Measure for Image Reconstruction from Irregular Frequency Samples
IntroductionImage Processing BasicsCurrent ResearchConclusion Problem StatementUnwrapping from 2-D to 1-DSensitivity MeasureNumerical Results Variance Measure • In 1-D, conditioning is easier to determine. • Condition number: O(n3) • Upper bound: O(n2) • Variance measure: O(n) • Variance measure quickly finds frequency configurations with better conditioning (ρ=0.7) or uniform 1-D frequency distribution. A Sensitivity Measure for Image Reconstruction from Irregular Frequency Samples
IntroductionImage Processing BasicsCurrent ResearchConclusion Problem StatementUnwrapping from 2-D to 1-DSensitivity MeasureNumerical Results Image Configuration • Original image size is 253253 and unwrapped 1-D solution, , has length 32,131. • CT data, , is sampled at the intersections, , of 254 slices with 507 diagonal gridlines. • System of linear equations: Head: www.lumen.luc.edu/lumen A Sensitivity Measure for Image Reconstruction from Irregular Frequency Samples
IntroductionImage Processing BasicsCurrent ResearchConclusion Problem StatementUnwrapping from 2-D to 1-DSensitivity MeasureNumerical Results Frequency Configuration • Over-determined number of frequency data locations used is 64,264 at slice intersections. • Simulated annealing optimizes angle configuration using Variance Measure as the cost function. Uniform-Angle Configuration (VarMeas = 61.7) Optimized-Angle Configuration (VarMeas = 21.8) A Sensitivity Measure for Image Reconstruction from Irregular Frequency Samples
IntroductionImage Processing BasicsCurrent ResearchConclusion Problem StatementUnwrapping from 2-D to 1-DSensitivity MeasureNumerical Results Reconstructed Images • System is solved using iterative preconditioned conjugate gradient (PCG) method. Uniform-Angle Reconstruction (RMSE = 3.91) Optimized-Angle Reconstruction (RMSE = 1.22) A Sensitivity Measure for Image Reconstruction from Irregular Frequency Samples
IntroductionImage Processing BasicsCurrent ResearchConclusion Problem StatementUnwrapping from 2-D to 1-DSensitivity MeasureNumerical Results Performance • Relative residual error versus PCG iteration • Uniform-angle configuration requires 203 iterations. • Optimized-angle configuration requires 134 iterations. A Sensitivity Measure for Image Reconstruction from Irregular Frequency Samples
IntroductionImage Processing BasicsCurrent ResearchConclusion Conclusion Conclusion • Image reconstruction takes measurement data and transforms it into an image. • We solve exactly using system of linear equations. • Unwrapped 2-D problem into 1-D which made uniqueness and conditioning (sensitivity) clear. • We developed the variance measure to estimate conditioning to help select optimal configuration of frequency data with lower sensitivity to noise. • Variance measure is quick to compute. • This led to lower amplification of noise and better quality images without the need for extra data. A Sensitivity Measure for Image Reconstruction from Irregular Frequency Samples
End Homer: www.qub.ac.uk/cskills/Images/Fun%20stuff/CT-brain.jpg A Sensitivity Measure for Image Reconstruction from Irregular Frequency Samples