Download
1 / 7
70 likes | 131 Views
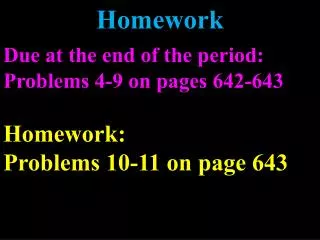
Pg. 336/369 Homework. Pg. 346 #1 – 14 all, 21 – 26 all Study Trig Info !! (Hint, Hint!!) #61 – 63 are on the next slide. Review Pg. 369 HW first . # 11 1.11 or 63.43 o #13 120 o or 2.09 #15 296.57 o or 5.18 #17 ½ #19 -1 #21 (2√3)/3 #23 (2√3)/ 3 #25 - ½ #27 -1

E N D
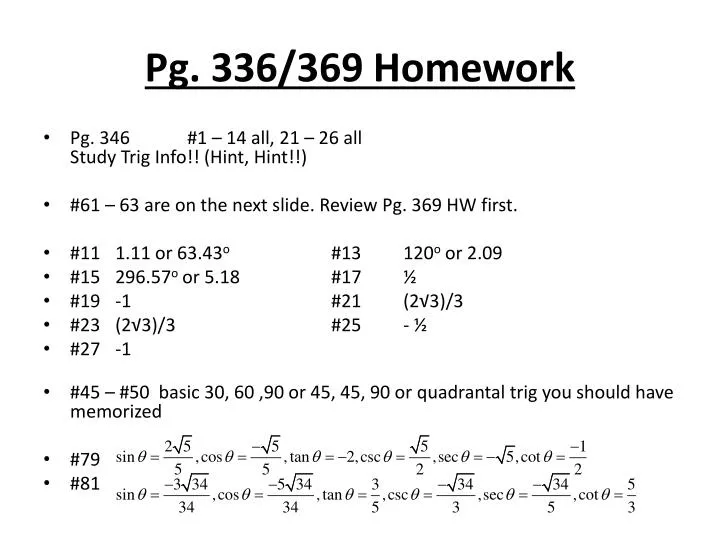
Pg. 336/369 Homework • Pg. 346 #1 – 14 all, 21 – 26 allStudy Trig Info!! (Hint, Hint!!) • #61 – 63 are on the next slide. Review Pg. 369 HW first. • #11 1.11 or 63.43o #13 120o or 2.09 • #15 296.57o or 5.18 #17 ½ • #19 -1 #21 (2√3)/3 • #23 (2√3)/3 #25 - ½ • #27 -1 • #45 – #50 basic 30, 60 ,90 or 45, 45, 90 or quadrantal trig you should have memorized • #79 • #81
**There are many ways you can solve these problems, but you canNOT cross the equals sign!!!
6.3 Graphs of sin x and cosx The Unit Circle The graph of sin x. The graph of cosx. • The Unit Circle can help us graph each individual function of sin x and cosx by looking at the unique output values for each input value. This gives us a domain and range. • Look at your Unit Circle. What do you notice about the input and output values?
6.3 Graphs of sin x and cosx sin x and cos x together Where do the maximums and minimums of the graphs occur? What is the domain? Range? Graph: y = sin xy = 2sin xy = 3sin xIn the same window. What do you notice? • Where do they intersect?How do you know?
6.3 Graphs of sin x and cosx Amplitude Period Length Graph: y = sin xy = sin (4x)y = sin (0.5x)In the same window. What do you notice? One period length of y = sin bx or y = cosbx is • Graph: y = cosxy = -2cos xIn the same window. What do you notice? • The amplitude of f(x) = asinx and f(x) = acos x is the maximum value of y, where a is any real number; amplitude = |a|.
6.3 Graphs of sin x and cosx Horizontal Shifts Symmetry of sin x and cosx Looking at the Unit Circle to help, think about the difference between the following: sin (-x) = -sin (x) cos (-x) = cos (x) • Remember our cofunctions and why they were true? Well, they are true with graphing too! • The cofunctions lead into shifts. If a value is inside with the x, it is a horizontal shift left or right opposite the sign. If it is outside the trig, it is up or down as the sign states.
6.3 Graphs of sin x and cosx Examples Graph the following: Solve for the following: sin x = 0.32 on 0 ≤ x < 2π cosx = -0.75 on 0 ≤ x < 2π sin x = -0.14 on 0 ≤ x < 2π cosx = 0.65 on 0 ≤ x < 2π • y = 4sin x • y = -3cos (2x) • y = sin (0.5x) + 1 • y = 2sin (x – 1)