Download
1 / 1

E N D
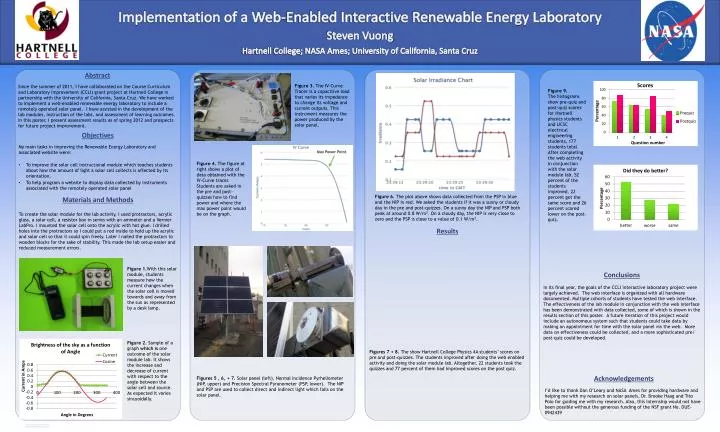
Since the summer of 2011, I have collaborated on the Course Curriculum and Laboratory Improvement (CCLI) grant project at Hartnell College in partnership with the University of California, Santa Cruz. We have worked to implement a web-enabled renewable energy laboratory to include a remotely operated solar panel. I have assisted in the development of the lab modules, instruction of the labs, and assessment of learning outcomes. In this poster, I present assessment results as of spring 2012 and prospects for future project improvement. Conclusions Abstract Objectives Materials and Methods Results In its final year, the goals of the CCLI interactive laboratory project were largely achieved. The web interface is organized with all hardware documented. Multiple cohorts of students have tested the web interface. The effectiveness of the lab module in conjunction with the web interface has been demonstrated with data collected, some of which is shown in the results section of this poster. A future iteration of this project would include an autonomous system such that students could take data by making an appointment for time with the solar panel via the web. More data on effectiveness could be collected, and a more sophisticated pre/ post-quiz could be developed. Acknowledgements I’d like to thank Dan O’Leary and NASA Ames for providing hardware and helping me with my research on solar panels, Dr. Brooke Haag and Tito Polo for guiding me with my research. Also, this internship would not have been possible without the generous funding of the NSF grant No. DUE-0942439 My main tasks in improving the Renewable Energy Laboratory and associated website were: To improve the solar cell instructional module which teaches students about how the amount of light a solar cell collects is affected by its orientation. To help program a website to display data collected by instruments associated with the remotely operated solar panel Steven Vuong Hartnell College; NASA Ames; University of California, Santa Cruz Implementation of a Web-Enabled Interactive Renewable Energy Laboratory Figure 3.The IV-Curve Tracer is a capacitive load that varies its impedance to change its voltage and current outputs. This instrument measures the power produced by the solar panel. Figure 9. The histograms show pre-quiz and post-quiz scores for Hartnell physics students and UCSC electrical engineering students, 177 students total. After completing the web activity in conjunction with the solar module lab, 52 percent of the students improved, 22 percent got the same score and 26 percent scored lower on the post-quiz. Max Power Point Figure 4. The figure at right shows a plot of data obtained with the IV-Curve tracer. Students are asked in the pre and post-quizzes how to find powerand where the max power point would be on the graph. Figure 6. The plot above shows data collected from the PSP in blue and the NIP in red. We asked the students if it was a sunny or cloudy day in the pre and post-quizzes. On a sunny day the NIP and PSP both peak at around 0.8 W/m2. On a cloudy day, the NIP is very close to zero and the PSP is close to a value of 0.1 W/m2. To create the solar module for the lab activity, I used protractors, acrylic glass, a solar cell, a resistor box in series with an ammeter and a Vernier LabPro. I mounted the solar cell onto the acrylic with hot glue. I drilled holes into the protractors so I could put a rod inside to hold up the acrylic and solar cell so that it could spin freely. Later I nailed the protractors to wooden blocks for the sake of stability. This made the lab setup easier and reduced measurement errors. Figure 1.With this solar module, students measure how the current changes when the solar cell is moved towards and away from the sun as represented by a desk lamp. Figure 2. Sample of a graph which is one outcome of the solar module lab. It shows the increase and decrease of current with respect to the angle between the solar cell and source. As expected it varies sinusoidally. Figures 7 + 8.The show Hartnell College Physics 4A students’ scores on pre and post-quizzes. The students improved after doing the web enabled activity and doing the solar module lab. Altogether, 22 students took the quizzes and 77 percent of them had improved scores on the post quiz. Figures 5 , 6, + 7. Solar panel (left), Normal Incidence Pyrheliometer (NIP, upper) and Precision Spectral Pyranometer (PSP, lower). The NIP and PSP are used to collect direct and indirect light which falls on the solar panel.