Download
1 / 6
60 likes | 171 Views
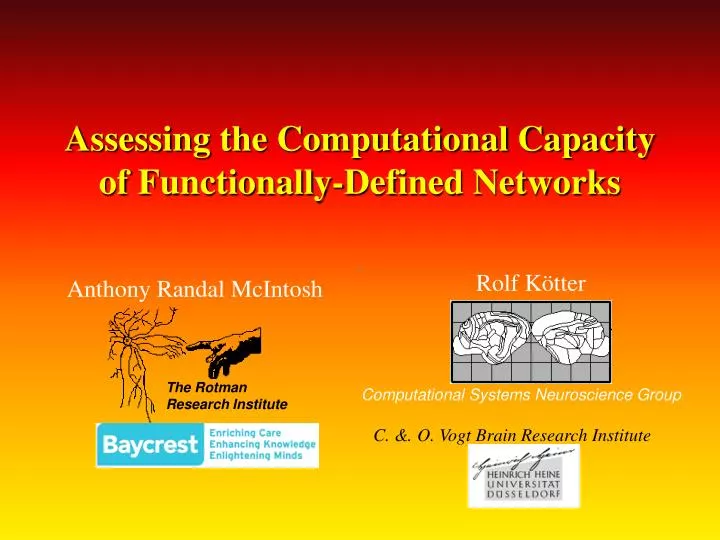
The Rotman Research Institute. Assessing the Computational Capacity of Functionally-Defined Networks. Rolf Kötter. Anthony Randal McIntosh. Computational Systems Neuroscience Group. C. &. O. Vogt Brain Research Institute. Network Participation Indices (NPI) & Regional Maps. Density

E N D
The Rotman Research Institute Assessing the Computational Capacity of Functionally-Defined Networks Rolf Kötter Anthony Randal McIntosh Computational Systems Neuroscience Group C. &. O. Vogt Brain Research Institute
Network Participation Indices(NPI) & Regional Maps • Density • Proportion of existing connections (afferent and efferent) relative to the number of all potential connections • 1.0 high density • Transmission • Proportion of outputs relative to the number of existing inputs and outputs • Outdegree & indegree in graph theory • T >0.5 more efferents, T<0.5 more afferents • Symmetry • Proportion of reciprocal connections relative to existing reciprocal and unidirectional connections • S >0.5 more reciprocal, S <0.5 more asymmetric Kötter & Stephan, Neural Net, 2003 Kötter & Wanke, Phil Trans R Soc B 2005
RM entire matrix STRESS=0.092
Awareness & Medial Temporal Lobe Functional Connectivity Aware Unaware Seed Seed Behavior Behavior McIntosh, Rajah & Lobaugh, J Neurosci, 2003
Aware PFCPOL STRESS=0.076 VACV PMCVL PFCVL Density PFCORB CCP CCA PFCCL PHC V1 VACD TCPOL Single Primary Cluster Significant regions show increase in density and transmission: TC V1 (transmission greater) VACv PHC PFCpol (symmetry) PCIP TCC PCI TCS Symmetry TCI V2 M1 CCS S1 Transmission
Unaware V1 STRESS=0.053 PFCVL PFCORB PHC PFCCL Density TCS CCP TCC Symmetry TCPOL PFCM Two Clusters based on density V1 isolation (no intermediate VA areas) Higher density: PFCm PFCorb PHC Reduced Transmission: PFCvl TCs IA PCI PMCVL TCI A2 Transmission