Download
1 / 9
90 likes | 198 Views
Read & Explain Evidence Activity. Students divided into groups. There are 8 different evidence cards ( ppt slides). First, read it. What’s it say? Then, explain it. What’s it mean? Discuss the data or observation shown on the card.

E N D
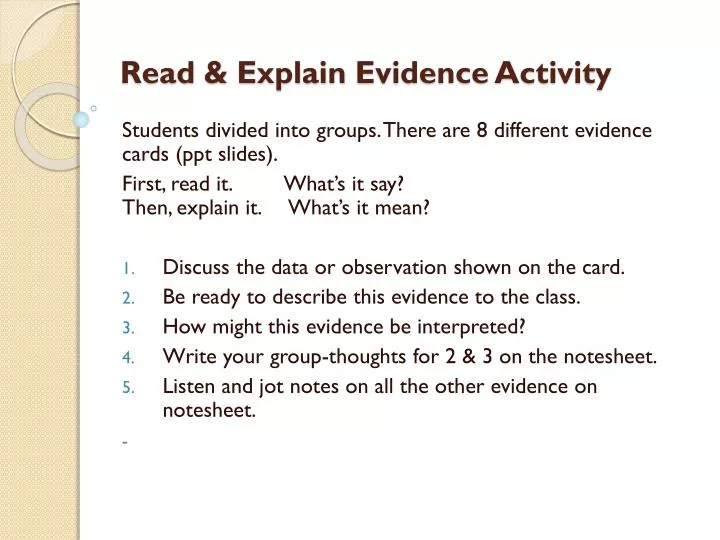
Read & Explain Evidence Activity Students divided into groups. There are 8 different evidence cards (ppt slides). First, read it. What’s it say? Then, explain it. What’s it mean? Discuss the data or observation shown on the card. Be ready to describe this evidence to the class. How might this evidence be interpreted? Write your group-thoughts for 2 & 3 on the notesheet. Listen and jot notes on all the other evidence on notesheet.
1. CO2 Concentration Curve Preponderance of Evidence Resource Card 2
2. Temperature (1880- 2005) Temperature Difference From Normal (°C) Year http://data.giss.nasa.gov/gistemp/graphs/ Preponderance of Evidence Resource Card 3
3. Shrinking Glaciers Muir Glacier, Alaska August 1941 August 2004 NSIDC/WDC for Glaciology, Boulder, compiler. 2002, updated 2006. Online glacier photograph database. Boulder, CO: National Snow and Ice Data Center. Preponderance of Evidence Resource Card 4
4. Increasing Wildfire Risk Western US area burned Source: Westerling et al. 2006 Preponderance of Evidence Resource Card 5
5. Ice Core Records CH4 (ppb) CO2 (ppm) Time (years) Source: Hansen, Clim. Change, 68, 269, 2005. Preponderance of Evidence Resource Card 6
6. Projected Changes in CA Summer Temp. UCS UCS Preponderance of Evidence Resource Card 7
7. Species Habitat Shifting 1900 >7,800 ft 2004 >9,500 ft Species that are sensitive to temperature conditions can only move up the mountainside as conditions get too warm for them lower down. In the Sierras, Pika were seen at 7,800 feet and above in 1900. By 2004, they were not seen below 9,500 feet. This trend is expected to continue. The mountains rise as high as 12,000 feet, but the rocky hillsides where Pika live do not reach that high. Pika Preponderance of Evidence Resource Card 8
8. Diminishing Sierra Snowpack Percentage Remaining, Relative to 1961-1990 UCS Preponderance of Evidence Resource Card 9