Download
1 / 35
350 likes | 477 Views
Mathematical models for ecological prognosis, design and monitoring V.V. Penenko. Institute of Computational Mathematics and Mathematical Geophysics SD RAS, Novosibirsk. What is the role of atmospheric chemistry in amplifying or damping climate change?.

E N D
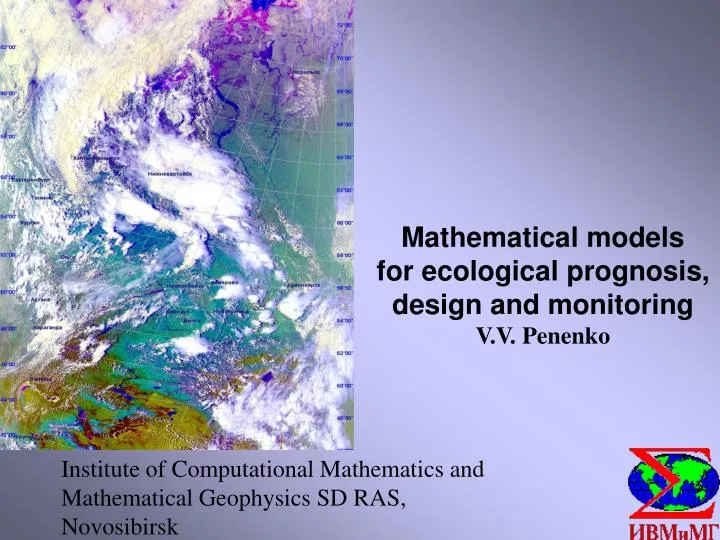
Mathematical models for ecological prognosis, design and monitoring V.V. Penenko Institute of Computational Mathematics and Mathematical Geophysics SD RAS, Novosibirsk
What is the role of atmospheric chemistry in amplifying or damping climate change? How will human activities transform the dynamical and chemical properties of the future atmosphere? How will quality of life change?
System organization of environmental modeling • Models of processes • hydrodynamics • transport and transformation • of pollutants Data bases Models of observations Functionals Quality, observations, restrictions, control, cost,etc. extended: functional +model as integral identity Solution of forward problems Solution of adjoint problems Calculation of sensitivity functions and variations of functionals Identification of parameters, decrease of uncertainties, data assimilation, monitoring Analysis of sensitivity relations risk/vulnerability, observability, sources System of decision making, design
Approaches and tools • Analysis of the climatic system for construction • of long-term scenarios: • Extraction of multi- dimentional and • multi-component factors from data bases • Classification of typical situations with respect • to main factors • Investigation of variability • Formation of “leading” spaces
Scenario approach Models of hydrodynamics Models of transport and transformation of pollutants (gases and aerosols) Sensitivity and observability algorithms Combination of forward and inverse techniques Joint use of models and data Nested models and domains
Transformation of moisture and pollutants Gases and aerosols • interaction with underlying surface • dry and wet deposition • condensation and evaporation • coagulation • Model of atmospheric chemistry • Model of aerosol dynamics • Model of moisture transformation • water vapour • cloud water • rain water
Model of aerosol dynamics -concentration of particles in volume - coagulation kernel; - rates of condensation and evaporation; - coefficients of diffusive change of particles; - removal parameter; -source term; -parameters of collective interaction of particles
Hydrological cycle of atmospheric circulation for studying aerosols Notations: - content of water vapor, cloud water and rain water in respectively - autoconversion of cloud water to rain water (*dt) - accretion of cloud droplets by rain drops (*dt) - evaporation of rain water(*dt) - condensation (evaporation)(*dt) If supersaturation -->condensation
Hydrological cycle input no no yes yes no no yes yes no yes yes yes output
The structure of the source term source power source shape reference point of the source Particular case
The main sensitivity relations The algorithm for calculation of sensitivity functions The feed-back relations are the sensitivity functions are the parameter variations
Factor analysis ( global scale). Reanalysis 1960-1999 hgt 500, june
West Siberia region 60-105 E, 45-65 N June, 1960-1999
Eigenfunction N1, June, 1960-1999 Global, 17% West Siberia, 97%
East Siberia Region 90-140 E, 45-65 N June,1960-1999
Eigenvectors N1, June, 1960-1999 Global, 17% East Siberia, 97%
. June 16 2003 г
Sensitivity relation for estimation of risk/vulnerability and observability
Sensitivity function for estimation of risk/vulnerability domains for Lake Baikal
Conclusion • Combination of • forward and inverse modeling • factor and principle component analysis • sensitivity theory • on the base of variational principles • gives the possibility for coordinated solution • of the variety of environmental problems, such as • diagnosis • prognosis • monitoring (mathematical background) • design