Download
1 / 13
140 likes | 160 Views
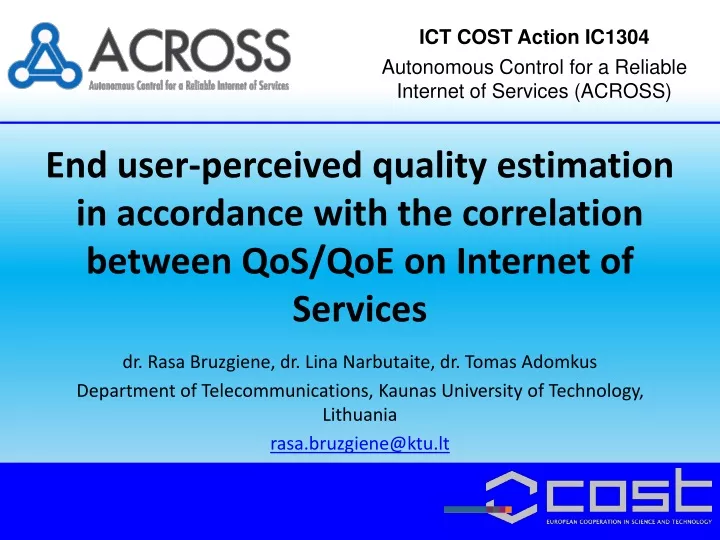
ICT COST Action IC1304 Autonomous Control for a Reliable Internet of Services (ACROSS). End user-perceived quality estimation in accordance with the correlation between QoS / QoE on Internet of Services. dr. Rasa Bruzgiene, dr. Lina Narbutaite, dr. Tomas Adomkus

E N D
ICT COST Action IC1304 Autonomous Control for a Reliable Internet of Services (ACROSS) End user-perceived quality estimation in accordance with the correlation between QoS/QoE on Internet of Services dr. Rasa Bruzgiene, dr. Lina Narbutaite, dr. Tomas Adomkus Department of Telecommunications, Kaunas University of Technology, Lithuania rasa.bruzgiene@ktu.lt
End user-perceived quality estimation in accordance with the correlation between QoS/QoE on Internet of Services Outline: • Introduction • Relationship between QoS/SLA and QoE • The conceptual model QoS/QoE correlation on IoS • The composition of QoE estimation in accordance of QoS/QoE correlation • Example of use case: Experimental investigations of IPTV QoE estimation 2
End user-perceived quality estimation in accordance with the correlation between QoS/QoE on Internet of Services Definition:QualityofExperience (QoE) is the term which is used to describe how it issatisfied by users to theprovided service quality. Problem:Thepoor QoE will cause dissatisfied users and fall behindin contestants due to the ultimately bad market competitivepower to contestants. Dependence:QoE is composedofnot only thenetwork performance parameter but also the service quality (QoS) parameter such as cost, reliability, availability, usability, and fidelity. Importance:Although QoE is very subjective in nature, it is veryimportant to measure it as realisticallyas possible.The ability to evaluate QoE will give the providersome senseofthe contributionofthenetwork'sperformance tothe overall levelofusers‘ satisfaction. 3
Relationship between QoS/SLA and QoE Quality of Learning (QoL) represents the aspects of the user and domain model. Quality of Flow (QoF) is based on feedback, interaction, emotions. 4
TheconceptualmodelQoS/QoEcorrelationon Internet ofServices 1
ThecompositionofQoEestimationinaccordanceofQoS/QoEcorrelationThecompositionofQoEestimationinaccordanceofQoS/QoEcorrelation • ThecompositionofQoEestimationisbasedonthreesubjects: • Input data fromnetworkpart • Input data fromuserperspective • AnalyticalmodelsforQoEadaptationandoptimization 6
ThecompositionofQoEestimationinaccordanceofQoS/QoEcorrelationThecompositionofQoEestimationinaccordanceofQoS/QoEcorrelation • ThecompositionofQoEestimationisbasedonthreesubjects: • Input data fromnetworkpart • Input data fromuserperspective • AnalyticalmodelsforQoEadaptationandoptimization 6
Exampleofusecase: Experimentalinvestigationsof IPTV QoEestimation MOS= -0,072x5 + +0,273x4 +2,014x3 - -12,752x2 + 21,276x – - 6,756 MOS= -0,032x3 + +0,627x2 - 4,020x + +9,372 MOS=1 1
Exampleofusecase: Experimentalinvestigationsof IPTV QoEestimation MOS= -0,072x5 + +0,273x4 +2,014x3 - -12,752x2 + 21,276x – - 6,756 MOS= -0,032x3 + +0,627x2 - 4,020x + +9,372 MOS=1 1
Exampleofusecase: Adaptation/Optimization/Feedback MOS= -0,072x5 + +0,273x4 +2,014x3 - -12,752x2 + 21,276x – - 6,756 MOS= -0,032x3 + +0,627x2 - 4,020x + +9,372 MOS=1 9
Exampleofusecase: Experimental investigations of IPTV QoE estimation The average difference between the calculated objective and the subjective assessments of IPTV Quality of Experience is 0.3. 10
Exampleofusecase: Influence to QualityofExperience MOS MOS 3,26 1,7 2,4 3,42 4,8 3,7 User's User's Tzap Tzap reaction reaction MOS Random change of IPTV channel Sequentially change of IPTV channel 4,7 1,8 1,56 User's Tzap reaction PiP EPG change of IPTV channel 11
End user-perceived quality estimation in accordance with the correlation between QoS/QoE on Internet of Services Two rivers meet in Kaunas, they join and never split up! Night view of magic Kaunas... Thank you for your attention. 12