Download
1 / 82
830 likes | 852 Views
Analysis of results and parameters derived from SDMT. 6th February 2013. Reporter: S. Amoroso. Banbury United Kingdom. www.marchetti-dmt.it. SDMT Test Layout. DMT (static). SDMT (dynamic). Measurements performed after penetration independant from insertion method.

E N D
Analysis of results and parameters derived from SDMT 6th February 2013 Reporter: S. Amoroso Banbury United Kingdom www.marchetti-dmt.it
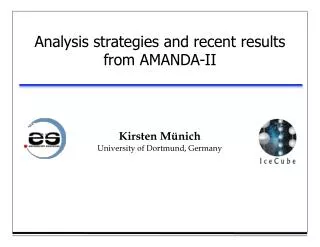
SDMT Test Layout DMT(static) SDMT(dynamic) Measurements performed after penetration independant from insertion method
DMT Intermediate parameters DMT Readings Intermediate Parameters Id: Material Index P0 Kd: Horizontal Stress Index P1 Ed: Dilatometer Modulus
Intermediate Parameters Id Ed Kd DMT Formulae – Interpretedparameters Interpreted Parameters M: Constrained Modulus Cu: Undrained Shear Strength Ko: Earth Pressure Coeff (clay) OCR: Overconsolidation ratio (clay) : Safe floor friction angle (sand) : Unit weight and description
DMT Formulae (1980) Po and P1 Intermediate parameters Interpreted parameters
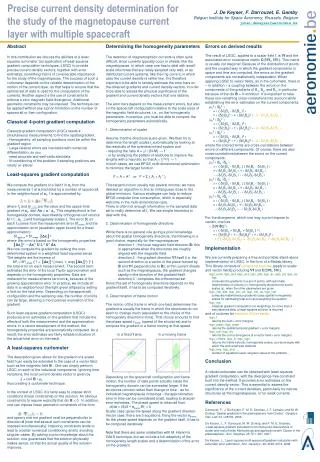
CLAY SAND p p p p p p 0 0 1 1 ID contains information on soil type Performing DMT, immediate notice that: SILT falls in between
ID contains information on soil type SAND CLAY
Reliability of material index ID ObviouslyID isnot a sieveanalysis. Eg. a mixturesand-claywouldprobablybe "wrongly" interpretedassilt. On the otherhandsuchmixturecouldperhapsbehavemechanicallyas a silt. The engineerisofteninterestedto the grainsizedistributionnot "per se", but just toinfermechanicalproperties, PERHAPS, in SOME cases, itcouldbebettertohave the ID interpretationthan the sieveanalysisresults and toinferfromthem the mechanical behaviour. A “mechanical” information (a sortofSoilType Behaviour Index) that, in design, mightbeeven more importantthan the granulometriccomposition.
(p0 - u0) KD = σ’v KD contains information on stress history DMT formula similar to Ko: (p0 – u0) σ’h KD is an “amplified” K0, because p0 is an “amplified” σh due topenetration p0 KD well correlated to OCR and K0 (clay)
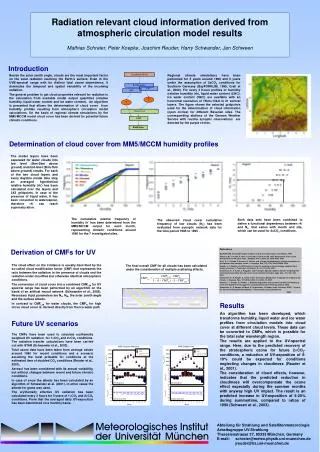
KD contains information on stress history Kd NC KD = 2 in NC clay (OCR = 1) OC Depth Z KD > 2 in OC clay (OCR > 1) 2
KD contains information on stress history NC Kd ͌ 2 OC Kd > 2 Taranto 1987
KDcorrelatedto OCR (clay) 1.56 Marchetti 1980 (experimental) OCR = 0.5 Kd Theoretical Finno 1993 Experimental Kamei & Iwasaki 1995 Theoretical Yu 2004
KD well correlated to K0 (clay) Kd 0.47 Marchetti 1980 (experimental) K0 = 0.6 1.5 Experimental Marchetti (1980) Theoretical 2004 Yu
ED contains information on deformation Theory of elasticity:ED = elastic modulus of the horizontal load test performed by the DMT membrane (D=60mm, 1.1 mm expansion) DMT 1.1 mm GravesenS. "Elastic Semi-Infinite Medium bounded by a Rigid Wall with a Circular Hole", DanmarksTekniskeHøjskole, No. 11, Copenhagen, 1960, p. 110. (P1-P0) ED= 34.7 ED not directly usable corrections (penetration,etc)
M obtained from Ed using information on stress history (Kd) and soil type (Id) Kd MConstrainedModulus Ed Id
How can be an undrained modulus Ed related to a drained modulus M In the earlydaysof DMT (1980) the initial idea wasobviouslyto correlate Ed-Eu, notEd-M. ButEd-Euimpossible. LabEuvaluestoodispersed. M valuesfromoedometerslessdispersed. Though the link Ed-Mispresumablyweaker, at leastit can betested. A correlationEd-Mmustbe a complexfunctionofmanyvariables, amongthem the Skemptonppparameters A & B and anisotropy (horiz. tovert. modulus), which in turn depend on soiltype (to some extentrepresentedbyId) and on OCR (to some extentrepresentedbyKd). TheseconsiderationsencouragedinvestigatingEd-MusingId,Kdasparameters. (Prof. Lambeof MIT (Jnl ASCE March 1977 “Foundation Performance ofTowerof Pisa” p.246) wrote: “E’ typically 1/3-1/4 Eu”. Thus a connection E’-Eualreadyinvoked in the past). Final word goestoreal world. SeveraldecadesofobservationsappeartoconfirmthatMdmtis a reasonable estimate of the operative M.
Ed mustbecorrectedtoobtain M M=Rm Ed with Rm=f(Kd,Id) Don’t use Ed as Young’s Rmhasvariouscorrectiontasks DistortionHoriztoverticalDrained Undrained Once Ed isconvertedto M, Young’s E’ 0.8-0.9 M (elasticity)
May use M = constant if 'v large ? M = Eoed=1/mv='v/v (at 'vo) • Vertical drained confined tangent modulus (at 'vo) • Same as Eoed, traditionally measured by oedometer • Usual range M 0.4 - 400 Mpa • Excepthighlystructuredclays (sharp break), M variationacrosspcis moderate • Error in assuming M ~ constant : oftenacceptable (othermethodsfor M : notinfrequenterrorfactors 2-3)
M Comparison from DMT and from Oedometer Tokyo Bay Clay - JAPAN Virginia - U.S.A. ONSOY Clay – NORWAY Constrained Modulus M (Mpa) Constrained Modulus M (Mpa) Failmezger, 1999 Iwasaki K, Tsuchiya H., Sakai Y., Yamamoto Y. (1991) "Applicability of the Marchetti Dilatometer Test to Soft Ground in Japan", GEOCOAST '91, Sept. 1991, Yokohama 1/6 Norwegian Geotechnical Institute (1986). "In Situ Site Investigation Techniques and interpretation for offshore practice". Report 40019-28 by S. Lacasse, Fig. 16a, 8 Sept 86
Cu correlation from OCRLadd SHANSEP 77 (SOA TOKYO) Ladd: best Cu measurement not from TRX UU !! Cu Cu best Cu from oed OCR Shansep = OCR m σ’v σ’v OC NC 1.56 OCR = 0.5 Kd Using m 0.8 (Ladd 1977) and (Cu/’v)NC 0.22 (Mesri 1975) 1.25 Kd Cu σ’v 0.22 0.5 =
Cu comparisons from DMT and from other tests Tokyo Bay Clay - JAPAN Recife - Brazil Skeena Ontario – Canada Coutinho et al., Atlanta ISC'98 Iwasaki K, Tsuchiya H., Sakai Y., Yamamoto Y. (1991) "Applicability of the Marchetti Dilatometer Test to Soft Ground in Japan", GEOCOAST '91, Sept. 1991, Yokohama 1/6 Mekechuk J. (1983). "DMT Use on C.N. Rail Line British Columbia", First Int.Conf. on the Flat Dilatometer, Edmonton, Canada, Feb 83, 50
“Complaint” : Cu field vane > Cu dmt (in very plastic clay) From Book “SoilMechanics in Eng. Practice” (byTerzaghi, Peck, Mesri) Cu field vaneneeds a correctionfactorbeforeit can beused in stabilityanalysys. The Bjerrumcorrectioniseg 0.70 when PI = 70. Cu field vanereducedbyBjerrum’s correctionisoftenconsidered the best available Cu forstabilityanalysis. The DMT 1980 correlationsfor Cu weredevelopedusingforcalibrationsuch“operative” Bjerrum’s-corrected Cu values. Itistherefore Cu field vaneuncorrectedwhichistoo high - in plastic clays.
Summary of DMT 2 step data processing DMTReadings Intermediate Parameters GeotechnicalParameters P0 P1 Id (soiltype) Kd (stress history) Ed (elasticmodulus) M Cu Ko OCR … …
Main SDMT applications • Settlements of shallow foundations • Compaction control • Slip surface detection in OC clay • Quantify σ'hrelaxation behind a landslide • Laterally loaded piles • Diaphragm walls • FEM input parameters • Liquefability evaluation • Seismic design (NTC08, Eurocode 8) • In situ G-g decay curves
Main Application: Settlement prediction LOAD SOIL DMT Boussinesq Δσv M Δσz Z Ʃ Δσz • 1-D approach (classic Terzaghi) • Primary settlement at working loads (Fs ͌ 2.5-3 to b.c.) • M must be treated as if by oedometer Δz S = M
Circular area: Settlement Prediction from DMT • M is evaluated for each Dz(0.20 m) by DMT • Dsis evaluated for each Dz (0.20 m) by Poulus & Davis • q = load • Primary settlement is evaluated by Poulus & Davis (1974)
Rectangular area: Settlement Prediction from DMT • M is evaluated for each Dz(0.20 m) by DMT • Dsis evaluated for each Dz (0.20 m) by Fadum Abacus • q = load • I = influence value • Primary settlement is evaluated by Rectangular area Fadum Abacus D D
Settlement Prediction from DMT Numerous case historiesoffavourablecomparisonsmeasured vs DMT-predictedsettlements (or moduli): • Lacasse & Lunne (1986) “Dilatometer Tests in Sand”. Proc. In Situ '86 ASCE Spec. Conf. Virginia Tech, Blacksburg.“Very good agreement between DMT-predicted and measured settlements under a silos at a sandy site” • Steiner W. (1994) “Settlement Behaviour of an Avalanche Protection Gallery Founded on Loose Sandy Silt”.Settlement '94 ASCE Conf. at Texas A&M.“The DMT-predicted settlements agreed well with observed settlements“ • Mayne & Liao Tianfei (2004) “CPT-DMT interrelationship in Piedmont residuum” . Proc. In ISC’2 Porto.“Over two decades of calibration between the DMT and measured foundation performance records have shown its value & reliability in settlements computation” • Vargas (2009), Bullock (2008), Monaco (2006), Lehane & Fahey (2004), Mayne (2001, 2004), Failmezger (1999, 2000, 2001), Crapps & LawEngineering (2001), Tice & Knott (2000), Woodward (1993), Iwasakiet al. (1991), Hayes (1990), Mayne & Frost (1988), Schmertmann (1986,1988), Steiner (1994), Leonards (1988), Lacasse (1986)…………….
Summary of comparisons DMT-predicted vs. observed settlements • Large No. of case histories good agreement for wide range of soil types, settlements,footing sizes • AverageratioDMT-calculated/observedsettlement 1.3 • Band amplitude (ratiomax/min) < 2i.e. observedsettlementwithin ± 50 % fromDMT-predicted Monaco et al. (2006)
M observed vs. predictedby DMT Sliding Micrometers installed every meter Marchetti et al. (2006) M by DMT vs. M back-calculated from LOCAL vertical strains measured under Treporti full-scale test embankment (Italy)
Treporti Test Embankment (Venezia) Before embankment construction After embankment removal Conclusion: OC increasesstiffnessespecially at operative modulus (working strain)
Applicability of Oedometer, SPT, CPT, PMT, DMT, to predict settlements of shallow foundations (GeoRisck – ASCE – Failmezger & Bullock 2011) • Oedometer: ...Testing is time-consuming and is typically performed at depth intervals exceeding 3 m...Sampling and handling disturbance... • SPT: ...The hammer type is often omitted... Extrapolation from a failure strain to an intermediate strain… • CPT: ...Extrapolation from a failure strain to an intermediate strain… • PMT: ... Static deformation to strain the soil to intermediate strains... Relatively slow test... Driller’s skill and experience • DMT: ...Static deformation to strain the soil to intermediate strains... The dilatometer test is therefore the best choice of in-situ tests for settlement prediction of shallow foundations... Mayne (2001)
Possible reasons DMT good settlement predictions Wedges deform soil less than cones • Modulus by mini load test relates better to modulus than penetration resistance Stiffness Strength measurezone measure zone Baligh & Scott (1975) • Availability of Stress History parameter Kd • Jamiolkowski(1988)“Without Stress History, impossible to select reliable E (or M) from Qc” • Robertson et al. (1986) “Prediction of soil stiffness from cone resistance can be rather poor, especially for OC soils” • Leonards (Asce 88) “Calculatingsettlements on granular soilsbased on correlations [Penetr. Resistance – SoilModulus] willseriouslyoverestimatesettlementsifdeposithasbeenprestressed.” SimilarstatementsbySchmertmann 70, Terzaghi 67…
RATIO = E/Qc OCR??? CC Jamiolkowski: = 2.5 to 25. Factor 10 ! Depends on OCR(?) Jamiolkowski concludes (Isopt-1, '88, Vol. 1, p.263) :"without Stress History it is impossible to select reliable E (or M) from Qc"
Effects of Stress History on CPT and DMT Effect of stress history on norm. Qc (x 1.10-1.15) Effect of stress history on Kd (x 1.30-2.50) Lee 2011, Eng. Geology – CC in sand
CC TEST N.216 IN TICINO SAND KD ++ sensitive to Stress History and aging than penetration resistance Jamiolkowski (ISC'98 Atlanta) applied prestraining cycles in calibration chamber. Found : KD(DMT)3 to 7 times more sensitive to AGINGthan penetration resistance PRESTRAINING CYCLES simulated AGING (similar mechanism: grain slippage) KD+20% qD+3%
Stress History also fundamental for liquefiability(e.g. Jamiolkowski 1985) • Lackof SH : probablyreason high scatter in the CPT-liquefactioncorrelations, possiblyreducedwith the SH info fromKd – or usedirectlyKd-CRRforliquefaction (eg Fig.14 Rob 2012). • Kd : thanksforexisting – a formidableparameterforsettlem. & liquef. Appears the onlyparameterreadilyavailabletodayreflectingclearly SH – notmany SH tools… • YetfordecadesTerzaghi, Skempton, Leonards, Schmertmann, Jam…havebeenpreaching (in essence) : without SH go nowhere. Kdis a bargain.
DMT for Compaction Control The high sensitivity to changes of stresses and density make the DMT particularly suitable for detecting benefits of SOIL IMPROVEMENT Compaction of a loose sandfill Resonant vibrocompaction technique Depth (m) Van Impe, De Cock, Massarsch, MengéNew Delhi (1994)
DMT vs CPT sensitivity to Compaction Schmertmann (1986) DYNAMIC COMPACTION of sand site. MDMT % increase twice % increase in qc. Jendeby (1992) monitored DEEP COMPACTION in a sand fill by VIBROWING. MDMT increase twice increase in qc. Pasqualini & Rosi (1993) VIBROFLOTATION job :"DMT clearly detected improvement even in layers where benefits were undetected by CPT". Ghent group (1993) before‑after CPTs DMTs to evaluate effects (h , Dr) by PILE (Atlas) INSTALLATION"DMTs before-after installation demonstrate more clearly [than CPT] beneficial effects of Atlas installation".
Compaction Control DMT vs CPT Jendeby (1992): Qc & Mdmt before & after compaction of a loose sandfill Beforecompaction Aftercompaction
Subgrade Compaction Control Bangladesh Subgrade Compaction Case History 90 km Road Rehabilitation Project MDMTacceptanceprofile (maxalwaysfound at 25-26cm) Acceptance MDMT profile fixed and used as alternative/fast acceptance tool for quality control of subgrade compaction, with only occasional verifications by originally specified methods (Proctor, CBR, plate), (Marchetti, 1994)
Slip surface detection in OC clay slopes (Totani et al. 1997) DMT-KDmethod Verify if an OC clay slope contains active (or old quiescent) slip surfaces
Slip surface detection in clay slopes Mine of lignite S. Barbara (San Giovanni Valdarno) SS. N. 83 “Marsicana” Gioia dei Marsi (2006) blocked