Download

1 / 27
270 likes | 273 Views
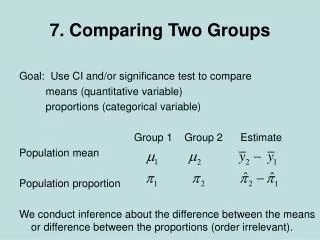
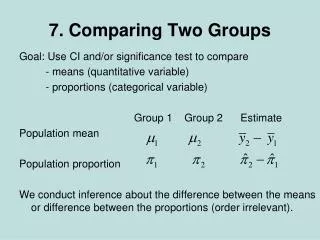
This chapter explores the analysis of dependent samples, also known as matched pairs, to compare means and proportions. It provides step-by-step instructions on calculating difference scores, conducting hypothesis tests, and constructing confidence intervals. Examples include analyzing reaction times while using cell phones and comparing belief in heaven and hell.

E N D
Chapter 10Comparing Two Groups Section 10.4 Analyzing Dependent Samples
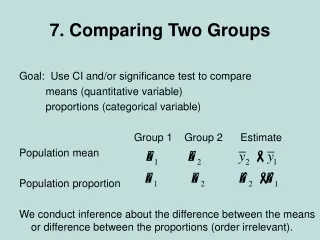
Dependent Samples Each observation in one sample has a matched observation in the other sample. • The observations are called matched pairs.
Example: Cell Phones and Driving The cell phone analysis presented earlier in this text used independent samples: • One group used cell phones • A separate control group did not use cell phones
Example: Cell Phones and Driving An alternative design used the same subjects for both groups. Reaction times are measured when subjects performed the driving task without using cell phones and then again while using cell phones.
Example: Cell Phones and Driving Data: Table 10.9 Reaction Times on Driving Skills Before and While Using Cell Phone The difference score is the reaction time using the cell phone minus the reaction time not using it, such as 636 - 604 = 32 milliseconds.
Example: Cell Phones and Driving Benefits of using dependent samples (matched pairs): • Many sources of potential bias are controlled so we can make a more accurate comparison. • Using matched pairs keeps many other factors fixed that could affect the analysis. • Often this results in the benefit of smaller standard errors.
To Compare Means with Matched Pairs, Use Paired Differences To Compare Means with Matched Pairs, Use Paired Differences: • For each matched pair, construct a difference score. • d = (reaction time using cell phone) – (reaction time without cell phone). • Calculate the sample mean of these differences:
To Compare Means with Matched Pairs, Use Paired Differences • The difference between the means of the two • samples equals the mean of the difference scores • for the matched pairs. • The difference between the population means • is identical to the parameter that is the population • mean of the difference scores.
Confidence Interval For Dependent Samples • Let n denote the number of observations in each sample. • This equals the number of difference scores. • The 95 % CI for the population mean difference is:
Paired Difference Inferences • To test the hypothesis of equal means, we • can conduct the single-sample test of with • the difference scores. • The test statistic is:
Paired Difference Inferences These paired-difference inferences are special cases of single-sample inferences about a population mean so they make the same assumptions. • The sample of difference scores is a random sample • from a population of such difference scores. • The difference scores have a population distribution • that is approximately normal. This is mainly important • for small samples (less than about 30) and for one- • sided inferences.
Paired Difference Inferences Confidence intervals and two-sided tests are robust: They work quite well even if the normality assumption is violated. One-sided tests do not work well when the sample size is small and the distribution of differences is highly skewed.
Example: Cell Phones and Driver Reaction Time The box plot shows skew to the right for the difference scores. Two-sided inference is robust to violations of the assumption of normality. The box plot does not show any severe outliers. Figure 10.9 MINITAB Box Plot of Difference Scores from Table 10.9 . Question: How is it that some of the scores plotted here are negative?
Example: Cell Phones and Driver Reaction Time • Significance test: • (and hence equal population means for the two conditions) • Test statistic:
Example: Cell Phones and Driver Reaction Time Table 10.10 Software Output for Matched-Pairs Analysis With Table 10.9
Example: Cell Phones and Driver Reaction Time The P-value displayed in the output is approximately 0. There is extremely strong evidence that the population mean reaction times are different.
Example: Cell Phones and Driver Reaction Time • A 95% CI for :
Example: Cell Phones and Driver Reaction Time We infer that the population mean when using cell phones is between about 32 and 70 milliseconds higher than when not using cell phones. The confidence interval is more informative than the significance test, since it predicts possible values for the difference.
Comparing Proportions with Dependent Samples A recent GSS asked subjects whether they believed in Heaven and whether they believed in Hell: Belief in Hell Belief in Heaven Yes No Total Yes 955 162 1117 No 9 188 197 Total 964 350 1314
Comparing Proportions with Dependent Samples We can estimate as: • Note that the data consist of matched pairs. • Recode the data so that for belief in heaven or hell, 1=yes and 0=no.
Comparing Proportions with Dependent Samples Sample mean of the 1314 difference scores is: • Note that this equals the difference in proportions, • We have converted the two samples of binary • observations into a single sample of 1314 difference • scores. We can now use single-sample methods with • the differences as we did for the matched-pairs • analysis of means.
Confidence Interval Comparing Proportions with Matched-Pairs Data • Use the fact that the sample difference, , is the • mean of difference scores of the re-coded data. • We can find a confidence interval for by finding a • confidence interval for the population mean of • difference scores.
Confidence Interval Comparing Proportions with Matched-Pairs Data We’ve already seen that the sample mean of the 1314 difference scores is . A 95% confidence interval for equals Sample mean difference , which is Table 10.13 Software Output for Analyzing Difference Scores from Table 10.12 to Compare Beliefs in Heaven and Hell.
SUMMARY: McNemar Test for Comparing Proportions with Matched-Pairs Data Hypotheses: , can be one or two sided. Test Statistic: For the two counts for the frequency of “yes” on one response and “no” on the other, the z test statistic equals their difference divided by the square root of their sum. (Assumption: The sum of the counts should be at least 30, but in practice the two-sided test works well even if this is not true). P-value: For , two-tail probability of z test statistic values more extreme than observed z, using standard normal distribution.
Example: McNemar’s Test: Speech Recognition Systems Research in comparing the quality of different speech recognition systems uses a series of isolated words as a benchmark test, finding for each system the proportion of words for which an error of recognition occurs. Table 10.14 Results of Test Using 2000 Words to Compare Two Speech Recognition Systems (GMDS and CDHMM)
Example: McNemar’s Test: Speech Recognition Systems The test statistic for McNemar’s Test: • The two-sided P-value is 0.000001, approximately 0. • There is extremely strong evidence against the null • hypothesis that the correct detection rates are the • same for the two systems. Note that this result agrees with the confidence interval for calculated earlier.