Download
1 / 24
240 likes | 243 Views
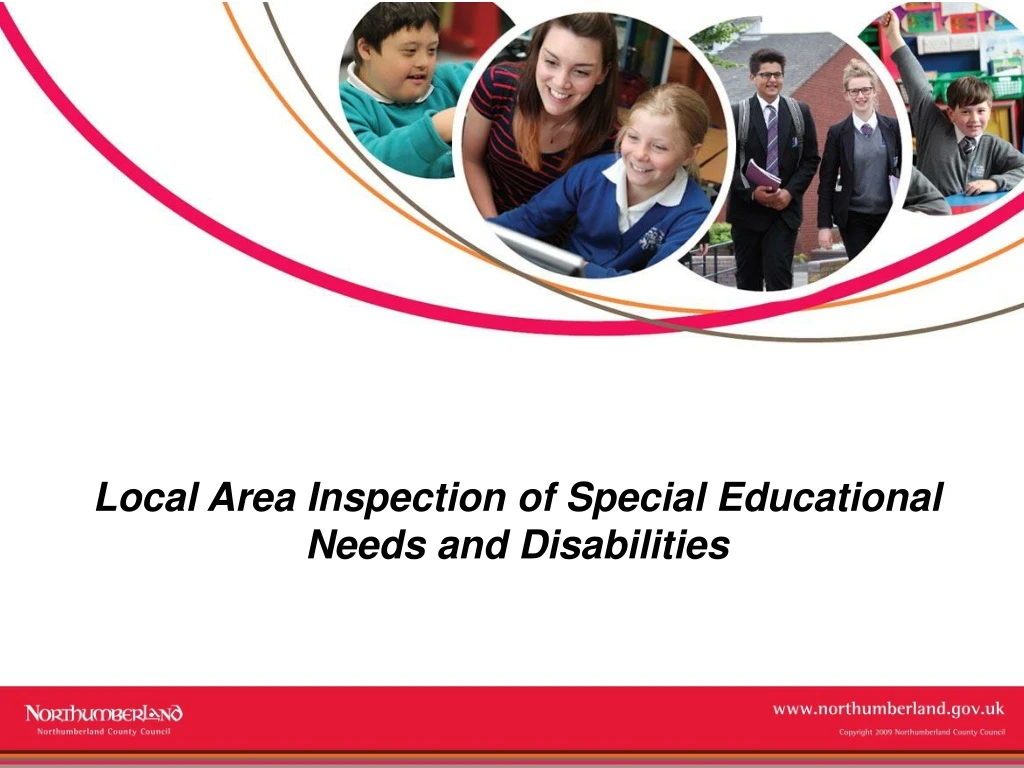
This report provides an overview of Northumberland schools and their provision for special educational needs and disabilities (SEND). It highlights areas of strength, improvement, and key priorities for the future.

E N D
Local Area Inspection of Special Educational Needs and Disabilities
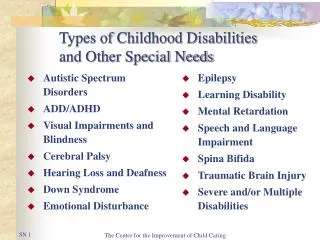
Our Schools • Northumberland has 123 first and primary schools, 42 middle and secondary schools, 9 maintained special schools and one pupil referral unit. • There are three independent schools in Northumberland (including one independent special school) and one non-maintained special school. 19 schools are academies or free schools. • All of the special schools are judged good or better by Ofsted. • Northumberland’s secure children’s home, Kyloe House, was judged good by Ofsted in July 2016. • 5 mainstream schools are judged to require special measures with one mainstream school judged to have serious weaknesses.
Headlines • Northumberland has a marginally higher than average proportion of pupils in primary or secondary education with SEND (16.8% compared to 14.9%). • The proportion of pupils in primary or secondary education with a statement or EHCP is at the 2015 National Average of 2.9%. There has been a slight downward trend since 2012. 1679 learners aged 0-25 have a statement or EHCP. This trend will change as the rate of request for new EHC Plans since 2015 is higher than the comparable rate of request for SEN Statements until 2014. • 7707 learners are eligible for SEN support. The proportion of pupils eligible for SEN support is above the 2015 national average (15.8%, compared to 12.1%).
Headlines • The most prevalent areas of need identified in Northumberland are Speech, Language and Communication (SLCN), moderate learning difficulties (MLD) and social, emotional and mental health needs (SEMH). • The proportion of pupils with a hearing impairment is slightly above the national average. • The proportion of pupils with no specialist assessment or identified as “other” type of need is much lower than the national average. This is a positive indicator, reflecting that fewer pupils in Northumberland are identified as SEND without a specific assessment of their individual needs. • the proportion of pupils with MLD attending specialist provision is lower than the national average, reflecting that pupils with MLD are more likely to remain in mainstream education. • The number of children who have significant medical needs and/or disabilities from birth is increasing. This appears to be due, in part, to improvements in survival from increasing levels of prematurity.
There is a higher than average proportion of pupils identified with needs for Speech/Language/Communication (SLCN) support in mainstream primary schools (+7.9%), with a lower proportion of pupils identified with specific learning difficulties (SpLD -5.8%). • Within mainstream secondary schools, the proportion of those with specific learning difficulties is much lower than the national average (-12.7%). • Some of this variation reflects a position where, because of the historical approach to specific learning difficulties such as dyslexia in Northumberland, some pupils have been identified as MLD or SLCN rather than SpLD. This is an issue which is now being addressed through our SEND specialist support services.
Improving outcomes • Performance at KS2 can not be compared to previous years, this is due to the significant changes to how pupils are assessed. • Outcomes at SEN are now compared with that of National Average All Other, this has meant that the gap has widened, with achievement well below National Average • Whilst outcomes are generally weaker at KS4 and are a key priority for improvement, the proportion of high needs EHCP learners achieving 5 A*-C grades including English and Maths at KS4 has increased from 7% in 2014 to 12.5% in 2016, however changes to performance measures has meant that pupils are performing considerably lower than National Average All Other Improvements and Successes