Download
1 / 20
210 likes | 546 Views
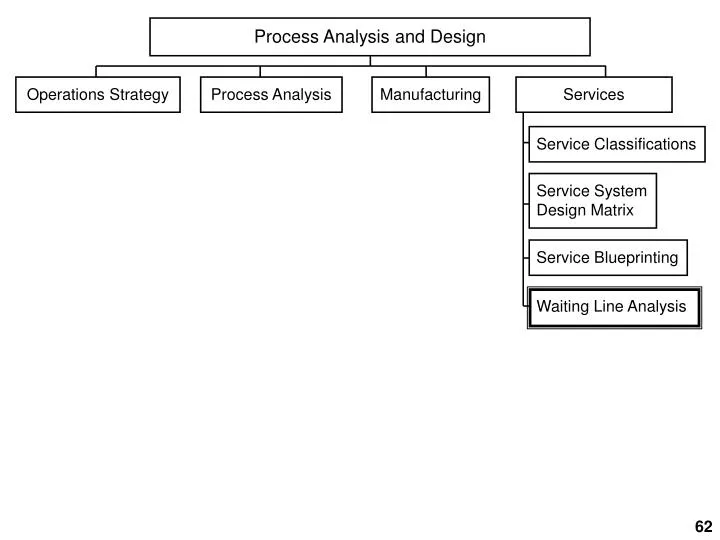
Service Classifications. Service System Design Matrix. Service Blueprinting. Waiting Line Analysis. Process Analysis and Design. Operations Strategy. Process Analysis. Manufacturing. Services. 62. Queues (Waiting Lines). People waiting to be served/machines waiting to be overhauled

E N D
Service Classifications Service System Design Matrix Service Blueprinting Waiting Line Analysis Process Analysis and Design Operations Strategy Process Analysis Manufacturing Services 62
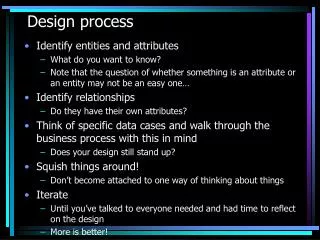
Queues (Waiting Lines) • People waiting to be served/machines waiting to be overhauled • Can’t have inventory in services! • The issue is the trade-off between cost of service and the cost of waiting 63
Suggestions for Managing Queues • Determine an acceptable waiting time • Divert customer’s attention while waiting • Inform your customers of what to expect • Keep other employees out of sight • Segment customers • Train employees to be friendly • Encourage customers during slack periods • Adopt a long-term perspective 63
Suggestions for Managing Queues For example, can control arrivals by: • Restricting the line (short line) - e.g., Wendy’s drive-thru • Post business hours • Establishing specific hours for specific customers or price - e.g., run specials; increase price for adult haircuts Can also provide faster (or slower) servers, machines, layouts, set-up times, etc. 63
Servicing System Server(s) Waiting Line Customer Arrivals Exit Components of the Queuing Phenomenon Population Source? Infinite or Finite Service Rate? Constant or Variable Infinite Queue Length FCFS Balking or Reneging? 64
Queuing Components • Arrivals from a finite population - Limited size customer pool (important distinction, as probabilities change after each customer) • FCFS (First come, first served) - most common priority rule, but not only one - can have emergencies first, best customers first, triage, etc. • Balking (look and then leave) vs. Reneging (wait for awhile and then decide to leave) 63
Queuing Components (cont’d) • Poisson Distribution: - The Poisson is the most common distribution used in queuing theory for arrivals - The Poisson distribution is discrete, as the number of arrivals must be an integer - The probability of n arrivals within a T minute period = PT(n)=(λT)n(e-λT)/n! 63
Queuing Components (cont’d) • Service Rates: - The capacity of the server (in units per time pd) (e.g., a service rate of 12 completions per hour) - Use the Exponential distribution when service times are random (as opposed to constant), where μ = avg # of customers served per time pd, and the probability the service time will be less than or equal to a time of length t: P = 1 – e-µt. 63
One-person barber shop Car wash Bank tellers’ windows Hospital admissions Line Structures Single Phase Multiphase Single Channel Multichannel (Also, “Mixed”; See text pages 251-52) 65
Properties of Waiting Line Models Source Model Layout Population Service Pattern 1 Single channel Infinite Exponential 2 Single channel Infinite Constant 3 Multichannel Infinite Exponential 4 Single or Multi Finite Exponential (See formulas for each model in text on page 253) These four models share the following characteristics: Single phase · Poisson arrival · FCFS · Unlimited queue length · 66
Waiting Line Models Characteristics of a waiting line model: • Lq =Average number in line • Ls = Average number in system • Wq = Average time in line • Ws = Average time in system • ρ = Utilization of Server • Pn = Probability of exactly n in system 67
Characteris-tics of Waiting Lines Definition Model 1 (single channel, exp. service rate) Model 2 (single channel, constant service rate) Lq Average number in line 2/[(-)] 2/[2(-)] Ls Avg. number in system /(-) Lq + (/) Wq Average time in line /[(-)] or Lq/ /[2(-)] Ws Average time in system 1/(-) or Wq +(1/) Wq +(1/) (“rho”) Utilization of server / - Pn Prob.of exactly n in system [1-(/)](/)n - Po Prob. of exactly zero in system 1 - (/) - Where = Arrival rate (e.g., = 2 would represent a mean arrival rate of 2 per minute), and = Service rate or avg number of customers served per time period (e.g., 1 per 3 mins =20 per hour). and must be in the same units. (corrected 5/3/05)
Example: Model 1 (worked problem) Drive-up window at a fast food restaurant. Customers arrive at the rate of 25 per hour. The employee can serve one customer every two minutes. Assume Poisson arrival and Exponential service rates. A) What is the average utilization of the employee? B) What is the average number of customers in line? C) What is the average number of customers in the system? D) What is the average waiting time in line? E) What is the average waiting time in the system? F) What is the probability that exactly two cars will be in the system? WP1
Example: Model 1 (worked problem) A) What is the average utilization of the employee? B) What is the average number of customers in line? WP2
Example: Model 1 (worked problem) C) What is the average number of customers in the system? D) What is the average waiting time in line? WP3
Example: Model 1 (worked problem) E) What is the average waiting time in the system? F) What is the probability that exactly two cars will be in the system (one being served and the other waiting in line)? WP4
Example: Model 2 (worked problem) An automated pizza vending machine heats and dispenses a slice of pizza in 4 minutes. Customers arrive at a rate of one every 6 minutes with the arrival rate exhibiting a Poisson distribution. Determine: A) The average number of customers in line. B) The average waiting time in the system. WP5
Example: Model 2 (worked problem) A) The average number of customers in line. l 2 2 Lq (10) = = = .6667 m m l 2 ( - ) (2)(15)(15 - 10) B) The average waiting time in the system. l 10 Wq = = = .06667 hr s = 4 mins m m l 2 ( - ) 2 ( 15 )( 15 - 10) 1 1 Ws Wq = + = .06667 hr s + = .1333 hrs = 8 mins m 15 / hr WP6
Approximating Customer Waiting Time A “quick and dirty” method has been developed to compute average waiting time for multiple servers (see text, pp. 261-2). No assumptions about the underlying distributions are required! All that is needed are 4 numbers – the average and standard deviation of the inter-arrival time and service time. 70