Download
1 / 20
200 likes | 201 Views
Learn how to use t-tests to compare average scores in educational studies. Explore one-sample t-tests, independent t-tests, and dependent t-tests. Understand assumptions, conditions, and statistical significance.

E N D
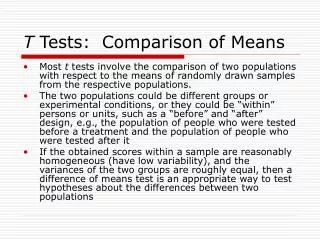
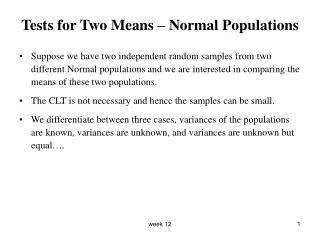
Overall Purpose • A t-test is used to compare two average scores. • Sample data are used to answer a question about population means. • The population means and standard deviations are not known.
The Three Types • There are three ways to use a t-test in a comparative educational study: • One sample t-test • Independent t-test • Dependent t-test
Dependent t-test • To compare one group to itself over time, or one group measured at two times. • The quantity of interest is the average gain or difference score across all the subjects. • Is the mean gain or difference greater than 0?
Dependent t-test • Examples • Pre-test vs. post-test for one group • The mean performance for the same group under two different drug dosage levels • Any kind of matched pairs situation (twins, husband and wife, matched students) where they are compared on some outcome of interest.
Dependent t-test • This is the simplest form of “repeated measures” design. • More commonly, we use ANOVA designs called Split-Plot designs. • These designs compare the growth rate of different groups of subjects over time.
Matched Pairs • The matched pairs design can increase the equivalence of the groups. • It can not replace random selection and random assignment. • You can never match subjects on all factors.
Matched Pairs • Consider this study. • What are the negative effects on cognitive development of drug treatment for leukemia on elementary-aged children? • What kind of control group can be used? • Random selection? Random assignment?
Matched Pairs • What are the negative effects on cognitive development of drug treatment for leukemia on elementary-aged children? • We used two types of matched control groups. • Sibling controls and matched children in remission. • What are the possible confounding variables?
Assumptions and Conditions • Normality • Random Sampling • Population Variance Not Known • Two observations from the same subjects.
Testing Assumptions • Normality • Histograms and boxplots • Visual inspection • Reasonably within sampling error of normal • Look at distribution of gain scores as well as distributions of the two observations • Homogeneity of Variance • We are only concerned with the variance of the gains. • However, it is useful to inspect the variance of each of the observations.
Identifying Conditions • Independence of Observations • No score influences another score • Study design feature • Independence between subjects, not within subjects. • Post test is expected to be related to pretest. • Random Sampling • This is a formal assumption • It is also a study design feature
Identifying Conditions • Population Variance Not Known • Sample data is used to make estimates of population parameters • Two observations from the same subject (or each member of the matched pair) • Design feature
Additional Considerations • Confidence intervals can be used to test the same hypotheses. • The confidence interval expresses a range of plausible values for the average gain. • “We are 95% confident that the average amount of gain from pretest to posttest for students in this program is between 5.38 and 7.25 points.”
Additional Considerations • You can also examine the correlation between pretest and posttest. • Low correlation makes the test no different than an independent t-test. • The higher the correlation, the more sensitive the t-test. • The higher the correlation, the more the rank order of the students remains the same from pretest to posttest.
Statistical Significance • You are most interested in whether the average amount of gain you observe (or difference in the sample means) is more than would be expected due to sampling error alone.
Statistical Significance • If the population means for the pretest and posttest are equal, your sample data can still show a difference due to sampling error. • The p value indicates the probability of gains such as those obtained, or larger, given that the null hypothesis is true and only sampling error has lead to the observed difference.
Hypotheses • Hypotheses for the Dependent t-test Null Hypothesis: • d = 0 or m1 - m2 = 0 Directional Alternative Hypothesis: • d > 0 or m1 - m2 > 0 Non-directional Alternative Hypothesis: • d =/= 0or m1 - m2 =/= 0 where: • m1 = population mean for time one • m2 = population mean for time two • d = the average difference between time one and time two.
Example • Our sample research design: • Head Start children randomly assigned to get in the program or be placed on the program’s waiting list. • Pre and Post test data collected on cognitive, social, and physical developmental outcomes • Measures scaled with mean=50, SD=10.
Example • Our sample research design: • The subjects were not randomly sampled. They are volunteers. The parents of the study children applied for admission to Head Start in neighborhoods where more children apply than can be served. • There are no other publicly funded preschool programs in the area for low income children.