Download

1 / 40
400 likes | 587 Views
PSPICE 计算机仿真. Simulation Program with Integrated Circuit Emphasis. CH5. OPERATIONAL AMPLIFIER 运算放大器. 5.1 Modeling OP Amps with Resistors and Dependent Sources. How to use PSpice to analyze a circuit containing an operational amplifier?. Fig.53. Example7.

E N D
PSPICE计算机仿真 Simulation Program with Integrated Circuit Emphasis
CH5 OPERATIONAL AMPLIFIER 运算放大器
5.1 Modeling OP Amps with Resistors and Dependent Sources • How to use PSpice to analyze a circuit containing an operational amplifier?
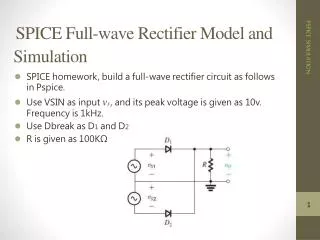
Example7 • The parameters for the operational amplifier in the circuit shown in Fig.53 are Ri=200kΩ, A=10E4, and Ro=5kΩ. • 1)Use PSpice to find Vi and Vo when Vg=1V(dc). • 2)Compare the PSpice solution with the analytic solution for Vi and Vo.
预备知识 • An equivalent circuit for an operational amplifier (Fig. 52)
Solution • Analog lib: R, E(VCVS) • Source lib: VDC
1)We used simple bias point analysis, therefore, • V(in) = -0.0028V(书上:0.0027V--?) • V(out) = -10.03V(书上:-9.9697V--?)
Ideal operational amplifer • If we assume that the operational amplifer in the circuit shown in Fig. 53 is ideal, we can altera the PSpice op amp schematic representation by making Ri and A very large and Ro=0.
To illustrate, we modify the schematic in Fig. 54, with R2=200 MΩ, A=10E8, and R4 removed from the schematic entirely. (Fig. 54a)
The resulting PSpice output file after bias point analysis is shown in Fig. 56. • The values of vi and vo from this simulation are • Vi=v(in)=-10E-9V (书上:100E-9V--?) • Vo=v(out)=-10V
2)We obtain the analytic solution for Vi and Vo by solving the following simultaneous node-voltage equations:
You should verify that the solutions for Vi and Vo are • Vi=2.742mV • Vo=-9.970V
Example8 • Repeat the analysis of the circuit shown in Fig.53, but this time use the uA741 model from the PSpice model library.
Solution • uA741在EVAL库中; • 需要在Place Part对话框,点Add Library…按钮,添加该元件库。
5.3 Modifying OP Amp Models • Place the model of the uA741 from the Eval Library in your circuit schematic. • Highlight the op amp component, select Edit/PSpice Model from the Capture menu. (Fig. 59a)
You define a subcircuit by inserting a .SUBCKT control statement • .SUBCKT SUBNAME N1 N2 N3 • You terminate the subcircuit description by inserting an .ENDS control statement • .ENDS <SUBNAME>
Now we create a new subcircuit based on the ideal op amp, consisting of a 1MΩ input resistor, a voltage-controlled voltage source with a gain of 10E6, and a 200 Ω output resistor.
Highlight the IdealOpAmp component; • Select Edit/Part from the Capture menu; • The result should look like the part shown in Fig. 61.
Highlight the new IdealOpAmp component; • Select Edit/Properties from the Capture menu. • The modified template is shown in Fig. 62.
example9 • Repeat the analysis of the circuit shown in Fig.53, but this time use the IdealOpAmp model we have just created.