Download

1 / 40
410 likes | 665 Views
Reading Success in a Multi-tier Schoolwide Reading Model. David Chard & Beth Harn Center on Teaching & Learning College of Education University of Oregon. Overview. Guiding principles and practices for schoolwide multi-tiered models of reading instruction

E N D
Reading Success in a Multi-tier Schoolwide Reading Model David Chard & Beth Harn Center on Teaching & Learning College of Education University of Oregon
Overview • Guiding principles and practices for schoolwide multi-tiered models of reading instruction • Examples of outcomes with schools and students • Lingering Questions and areas for research • Understanding the instructional needs of students requiring tier-3 instructional supports
Acknowledgements • Conceptualization and support in completing this project was heavily influence by Edward Kameenui, Deborah Simmons, Roland Good, and Mike Stoolmiller • The research presented here was funded by the Office of Special Education Programs Grant No. H324X010014. This material does not necessarily represent the policy of the U.S. Department of Education, nor is the material necessarily endorsed by the Federal Government • Appreciation and recognition is also provided to the amazing administrators, teachers, staff and parents in the Bethel and Tigard-Tualatin School Districts
The Role of Instruction for At Risk Learners Classroom instruction is the “single best weapon against reading failure”(NRC, 1998, p. 343) • Instruction is comprised of two components: • What is taught • Content of knowledge to be learned • Early reading: phonological awareness, alphabetic principle, vocabulary, comprehension, and fluency with connected text(NRP, 2000; Simmons & Kameenui, 1998) • How the content is designed and delivered(Engelmann & Carnine, 1991; Simmons & Kameenui, 1998) • How the content is organized, structured, and sequenced • Time and grouping structures devoted to learning • The explicitness of the instructional language in communicating specific skills and strategies to support, integrate and expand student learning
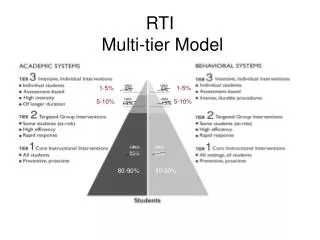
Prerequisites of Multi-Tiered Approaches • Promoting a systems approach focused on prevention • Integrating, coordinating, and differentiating academic and behavioral supports • Using screening and progress monitoring measures • Making data-based decisions with a dual focus on both the group and individual student levels • Employing evidence-based teaching practices (Chard, et al. in press; Kame’enui, Good, & Harn, 2005; Sugai & Horner, 2006)
Example of a Multi-Tiered approach to Improving Reading Outcomes Project CIRCUITS (Center to Improve Reading Competence Using Intensive Treatments Schoolwide) • The overarching goal of Project CIRCUITS is to implement, evaluate, replicate, and disseminate systemic prevention models that will accelerate and sustain the early reading achievement of students with reading disabilities or at risk of disabilities in grades K-3. • A five-year longitudinal study funded by the Office of Special Education Programs ($4.5 million). Initially awarded to Deb Simmons, Edward Kameenui, Roland Good and David Chard. Currently, David Chard and Co-Principal Investigator, Beth Harn.
Examining Learning Efficiencies at the Systems Level • Goal of Project CIRCUITS is to assist schools in building capacity and sustainability of a three-tier prevention model (schoolwide reading) by: • Using schoolwide assessment data in early literacy skills to identify students at risk for reading difficulties, make instructional decisions, and monitor progress • Implementing research-based interventions at the secondary and tertiary levels for students at risk for reading difficulties • Providing professional development to school staff to implement interventions effectively
To reduce complications from established cases of severe difficulty learning to read To reduce the duration of existing cases (prevalence) of severe difficulty learning to read To reduce the number of new cases of severe difficulty learning to read
Context of the Two Districts • Districts with established system-level features to promote effective social and reading behaviors • Bethel School District: Has implemented PBS and schoolwide reading approaches for more than 3 years prior to this project • 4 elementary schools participated • Major thanks to the following: Rhonda Wolter, Drew Braun, Ginger Kowlko, Kim Breeding, Charlotte Howard, and the many amazing teachers, paraprofessionals, and principals committed to their students • Tigard-Tualatin School District: Has implemented PBS and schoolwide reading approaches for more than 3 years prior to this project within their Effective Behavior and Instructional Support (EBIS) Project • 5 elementary schools participated • Major thanks to the following: Pam Zinn, Carol Sadler, Janice Best, Jennifer Duncan, and the many amazing teachers paraprofessionals, and principals committed to their students
Summary of System-Level Features • Year 01 (2002-2003): Examined the features, components, and characteristics of primary, secondary, and tertiary interventions in grades K-1 in 9 elementary schools. Data collected included: • Instructional Observation Data to capture reading instruction across primary, secondary, and tertiary settings (Winter & Spring) using the ICE-R Coding System • Student achievement monitored across grades K & 1 (DIBELS, WRMT-R) • Programmatic/curricular, planning and support, group size, time allocated, etc.
Summary of System-Level Features Summary of Yr 1 Instructional Observations in Kindergarten: Differences Across Settings Differences Across Districts
Summary of System-Level Features Summary of Yr 1 Instructional Observations in First Grade: Differences Across Settings Differences Across Districts
Understanding the Relation Between Measures • Strong (.75) correlation between Fall NWF and Spring ORF; however, visual inspection indicates a non-linear relation for students with higher initial NWF performance • A point of diminishing return between NWF and ORF? Relation becomes less linear Mid-year criterion on NWF
High Performing Students Changing Relation of NWF to ORF by Initial Score on NWF Non-Risk Students At-Risk Students Non-Linear Relation Linear Relations
Examining Instructional Alignment • Year 02 (2003-2004): Examined the efficiencies of aligning instructional supports across settings (general education and supplemental) compared to similar performing students in nonaligned interventions within the same systems the year before (historical control) • Secondary Supports:30-minute small group intervention • What was taught – word reading, phonics, and fluency development • Design Feature Examined – alignment across instructional settings, review of essential skills, explicit instructional delivery • Tertiary Supports:60 minute small group intervention • What was taught – phonological awareness, word reading, phonics, and fluency development • Design Feature Examined – alignment across instructional settings, increased time, review of essential skills, explicit instructional delivery
Effects of Aligning Instructional Supports on Established Systems
Effects of Aligning Instructional Supports on Established Systems NWF ORF
Effects of Aligning Instructional Supports on Established Systems Word ID Word AT
Effects of Aligning Instructional Supports on Established Systems Total Reading Pass Comp
Examining Students Within Systems • Year 03 (2004-2005): Interventions for 2nd Grade • Secondary: 45-minute small group intervention • What was taught – word reading, phonics, vocabulary and fluency development • Design Feature Examined -- the nature of text type/control/redundancy within a fluency building intervention • Results: no effect for text type in fluency development on a comprehension, word reading and connected text fluency • Tertiary: Two, 45 minute sessions of small group intervention • What was taught – word reading, phonics and fluency development • Design Feature Examined -- temporal implementation of fluency intervention; level of implementation support • Results: wide variability in student response to intensive interventions, yet fluency instruction was important in improving outcomes (discussed in later session)
Examining Students Within Systems • Students requiring tertiary instructional support: Students reading less than 20 ORF at the beginning of second grade • Project Implemented Intervention Students • 17 students across 5 schools • School Implemented Intervention Students • 18 students across 4 schools • Design of Instructional Program Selected to Accelerate Learning • Research-based, explicit, systematic: Reading Mastery/Fast Cycle, and added Read Naturally in February to increase time reading connected text • Delivery of Intervention Efforts • Two 45-minute periods of instruction each day (Nov. 1- May 20) • Small group instruction (i.e., 1-4) • Placement based on instructional needs • Groups modified as data and instructional needs warranted
Year-Long PM on ORF by Sub-Group Sep-Feb 14 Slopes (word per/wk) A = 1.10 B = .94 C = 1.08 Feb 28-Apr 28 Slopes (word per/wk) A= 2.58 B= 2.22 C= 1.92
End of Year Performance • Range of Spring ORF performance (all started between 7-17 in Fall) • Still have a number of students with severe reading difficulties even after two years of highly intensive, well designed interventions.
Variability in Response to Instruction Students Who Made the Most Progress in Response to Intensive Interventions
Variability in Response to Instruction Students Who Made the Least Progress in Response to Intensive Interventions
Examining Students Within Systems • Year 04 (2005-2006): Interventions for 3nd Grade • Secondary: 30-minute, small group intervention • What was taught – word reading, comprehension, vocabulary and fluency development • Design Feature Examined -- the nature of explicit delivery and content focus (time spent on which areas, vocab, comp, etc.) • Results: Preliminary findings, no significant mean differences across conditions; however, possible different effect of initially lower students to the more explicit condition • Tertiary: Two, 45-minute, small group, more individualized interventions • What was taught – word reading, phonics, comprehension, and fluency development • Design Feature Examined – need to individualized modifications to program delivery to accelerate learning • Results: students requiring this level of support made progress; however, not at a rate we would hope
Examining Students Within Systems • Variability of response to intensive intervention for students receiving tier-3 supports • Intervention (11 students across 5 elementary schools): Each student received two, 45 minute, instructional session in groups of 3 or less in addition to at least 30 minutes of reading instruction in the general classroom
Predicting Later Reading Outcomes: A Retrospective Approach • Examining variables related to predicting 3rd Grade performance on the SAT-10 within the context of supportive, tiered instructional support systems • Unalterable Variables/Demographics: Gender, English Language Learner, Ethnicity, Special Education status • Findings: Females performed lower; African American performed lower than Caucasians; no effect of ELL, Sped Status • Student Variables: • Behavior: Social Skills, Problem Behaviors, Academic Competence • Findings: Students with more Problem Behaviors performed lower; Students with higher ratings of Academic Competence performed better; no effect for Social Skills • Initial Literacy Skills (Scores in First Grade): LNF, PSF, NWF, WRMT; Growth/slope on ORF across grades 1-3; Spring of First Grade ORF • Findings: Fall/Spring PSF; WRMT, Spring 1st Grade ORF; Growth/slope ORF (best predictor)
Predicting Later Reading Outcomes: A Retrospective Approach • Overall model including all predictors accounted for: • 71% of variance on SAT10 • 77% of Spring 1st ORF • 11% of Growth on ORF • Growth on ORF is the best predictor of performance on SAT-10; however, with the variables included in this analysis we account for little for how growth occurs. • Something not measured is making the skill of reading connected text improve, what might this be? • Other demographic variables not measured • Other early student skill variables not measured • The nature of the instructional practices that occurred across the 3 years and experiences in kindergarten
Examining Student Response to Interventions • Dynamic Systems (DS) Approach: Designed to “highlight nonlinear (complex, indirect, disproportionate) relations among causally connected events, multiple causality, feedback relations, and so forth.”(Lewis, 2004, p. 666) • Understanding the process, not only the outcome • Identifying and appreciating phase transitions, or periods of qualitative reorganizations (increased or differential variability) in the development of systems across time • More frequently used to examine the variables involved in the development of antisocial behavior(Hollenstein, Granic, Stoolmiller, & Snyder, 2004; Paterson, DeGarmo, & Forgatch, 2004)as well language development(Thelen & Smith, 1998; van Geert & van Dijk, 2002)
Examining Student Response to Interventions with Nonlinear Methods • The hallmark of the most difficult to teach students, variability of performance within and across time • The DS approach examines intra-individual variability not due to measurement error • “variability is viewed as a potential driving force of development and a potential indicator of ongoing processes” of development and learning(van Geert & van Dijk, 2002, p. 341) • Periods of large variability are “harbingers of change” and are “contributors to change itself” (Bertenthal, 1999) • These phase transitions may be critical opportunities for intervention(Lewis, 2004; Thelen & Smith, 1993)
Patterns of Student Performance & Relation to Later Instructional Support Needs Progress Monitoring Data for Students in First GradeNot Needing Additional Instructional Support as 3rd Graders Ginger Brian Nick
Patterns of Student Performance & Relation to Later Instructional Support Needs Progress Monitoring Data for Students in First GradeContinuing to Need Intensive Instructional Support as 3rd Graders Tim Steve Allen
Examining Student Response to Interventions with Nonlinear Methods • Struggling readers need instruction that is “more intensive, more relentless, more precisely delivered, more highly structured, and direct and more carefully monitored for procedural fidelity and effects”(Kavale, 1988, p. 335) • May there be critical windows of receptivity where interventions could be intensified to accelerate and maximize learning? • Could certain nonlinear patterns of learning inform us to use different instructional methodology/focus for students typically described as “treatment resistors”? (Torgesen, 2001)
Putting it All Together Working as a Team to Maximize Resources & Outcomes for Students • Instruction: • Coordinating instructional resources (Title, Special Education, ELL, etc.) • Prioritizing and protecting instructional time (sufficient time for students needing additional support) • Strategic use of grouping to maximize learning • Programs and Materials: • Ensuring comprehensive coverage to essential literacy skills (program used with all) • Use of research-based targeted programs (Supplemental and Intervention) for specific students or to fill needs of groups of students • Progress Monitoring: • Evaluating benefits for students, classrooms, and districts • Professional Development: • Instruction: Scheduling, grouping, behavior management • Programs and Materials: understanding the complexities and nuances • Progress Monitoring: Interpreting data at the school, class, and student level
Coordinating a Schoolwide Instructional Support Plan: 3-Tier Instructional Support Plan
Three-Tier Plan Across Grades: Coordinating Instructional Supports
School B School A • Variability in School-Level Outcomes for At-Risk Students • When examining the alignment of instructional supports in first grade (Year 2 of Project), two schools who did the “same things” (time, programs, groupings) got very different results both: • across years (compared to themselves) • across sites (compared to each other)
Future Areas of Investigation & Research • System-Level • Ensuring Implementation • Variables most related to implementing successful and effective 3-tier-models • Delivery of interventions • Professional development, fidelity, planned design variation interventions, scheduling, allocation of resources • Response to Intervention • Appreciating the role of intensity of intervention (time, grouping, focus) • Student-Level • Demonstrating the impact of instruction on neurological development (collaboration with Helen Neville at Brain Development Lab ) • The role of attention, entry-level skills (language) • Determining if critical periods of intervention receptivity • Including intervention intensity relation to magnitude of student difficulty • Different sequence of skills, different grouping structures, scheduling of delivery, content, etc.