Download
1 / 7
80 likes | 335 Views
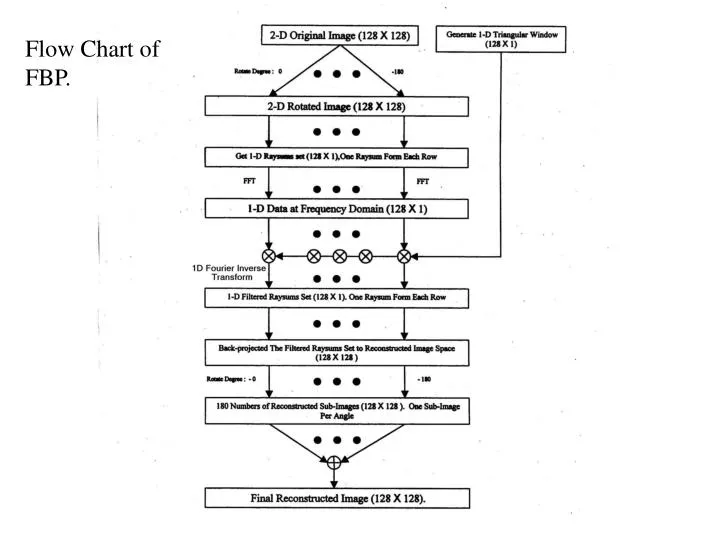
Flow Chart of FBP. BME 525 HW 1: Programming assignment The Filtered Back-projection Image reconstruction using Shepp-Logan filter You can use any programming languages, Fortran, C , C++ or Matlab ( without employing built-in functions for image reconstruction, radon( ) and iradon( ) ).

E N D
BME 525 HW 1: Programming assignment • The Filtered Back-projection Image reconstruction using • Shepp-Logan filter • You can use any programming languages, Fortran, C , C++ or Matlab ( without employing built-in functions for image reconstruction, radon( ) and iradon( ) ). • Example of steps: • Step1 : Creating Phantom image • Hint: • - Using an odd sized image might ease computations by having a center ray. • - Make 2 phantom images : • small one for testing program ( 63x63 ) • large one for presentation ( 255x255 )
Step2 : Calculate Projection data and Construct Sinogram: 1. Define the step-size of angle, theta. 2. Define the number of rays per view, m. 3. Calculate the projection data • - The projection of the image intensity along a radial line oriented at angle theta k and distance tk from origin. : Line integral along a line • original phantom f(x,y) • - Rotate f(x,y) by a given theta • rotated and interpolated f(x,y)
- Sum all pixel values on each row of the rotated and interpolated f(x,y): This is to calculate projection data or ray sums or line integrals. ray sum
4. Construct Sinogram - Sinogram is a collection of Projection data for all theta ( n x m matrix ) - Repeat step 3 for all theta you define sinogram
Step 3: Shepp-Logan filtering and Reconstruct phantom image • 1. Design Shepp-Logan fileter HSL(w) 2. Filtering Signogram in frequency or spatial domain. • sinogram before filtering • sinogram after S-L filtering
3. Reconstruct image from filtered sinogram. 64*64 256*256 Original