Download
1 / 34
340 likes | 490 Views
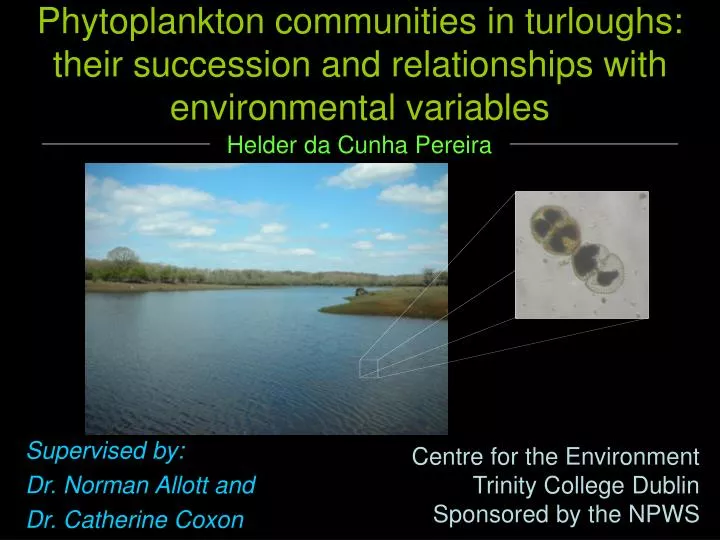
Phytoplankton communities in turloughs: their succession and relationships with environmental variables. Helder da Cunha Pereira. Supervised by: Dr. Norman Allott and Dr. Catherine Coxon. Centre for the Environment Trinity College Dublin Sponsored by the NPWS. What are turloughs?.

E N D
Phytoplankton communities in turloughs: their succession and relationships with environmental variables Helder da Cunha Pereira Supervised by: Dr. Norman Allott and Dr. Catherine Coxon Centre for the Environment Trinity College Dublin Sponsored by the NPWS
What are turloughs? • Turloughs are depressions in karstic areas that flood seasonally (mostly by • groundwater), and that support soils and ecological communities characteristic • of wetlands; • Mostly in the West of Ireland; Garryland May 2007 Garryland November 2006
What we already know • Nutrients and Chl a levels are the same as in permanent annual lakes; • Algal biomass peaks throughout the season, even in winter; • Phosphorus limits phytoplankton biomass in most turloughs, • at the same level found for permanent lakes
Sampling of 22 turloughs from October ‘06 until they dried (March-June ‘07); • Surface water sampled from the shore (depth ~0.5m); • Phytoplankton counted and identification to species where possible; • Biovolume calculation for • all taxa; • Chemical analyses of • water; • (N, P, alkalinity, etc.) • Hydrological • measurements. • (Owen Naughton)
Questions I am going to address: • What are the most predominant taxa in turloughs? • (direct summary statistics) • How do turloughs differ in terms of their communities? • (unconstrained ordination methods - MDS) • What are the main environmental drivers of phytoplankton composition? • (constrained ordination methods - RDA) • How do algal communities vary over time? • (patterns in turloughs of dominant taxa) • Interpret the results based on the known ecologies of the algae found • (phytosociology, Reynolds functional groups, adaptive strategies, physiology, etc.)
Predominant taxa in turloughs Cryptophytes Cryptomonas Chroomonas acuta Small Diatoms Synedra A.minutissima Nitzschia n.i. pennates centrics (more occasionally) D functional group Fast growing, nutrient efficient algae. Tolerant to low light, low temperature & shallow mixed depth. Present in “shallow turbid waters including rivers” Y & X2 functional groups: “All lentic environments where grazing pressure is low” / “Shallow, meso-eutrophic waters”
Predominant taxa in turloughs centrics Nitzchia Mougeotia Spirogyra Bulbochaete Dynobrion Tribonema Synedra nana n.i. pennates Oedogonium A. minutissima Cryptomonas Synedra (big) Synedra (small) Chlamydomonas Chroomonas acuta
Predominant taxa in turloughs centrics Nitzchia Mougeotia Spirogyra Bulbochaete Dynobrion Tribonema Synedra nana n.i. pennates Oedogonium A. minutissima Synedra (big) Synedra (small) Cryptomonas Chlamydomonas Chroomonas acuta
Predominant taxa in turloughs centrics Nitzchia Mougeotia Spirogyra Bulbochaete Dynobrion Tribonema Synedra nana Oedogonium n.i. pennates Synedra (big) A. minutissima Cryptomonas Synedra (small) Chlamydomonas Chroomonas acuta
Predominant taxa in turloughs centrics Nitzchia Mougeotia Spirogyra Bulbochaete Dynobrion Tribonema Synedra nana n.i. pennates Oedogonium A. minutissima Synedra (big) Cryptomonas Synedra (small) Chlamydomonas Chroomonas acuta
Differences between turloughs 2D stress: 0.13 45.0%
Differences between turloughs low TP (≤25 μg/L) high TP (≥20 μg/L) short hydroperiod 45.0% coloured 46.9% 54.1% 2D stress: 0.13
Environmental drivers of community structure 0.8 mean depth temperature flooded -0.8 -0.6 0.8 12.7% of species variability 69.5% of species-environment relation
Temporal succession 7 “coloured” 6 5 4 Mean depth 3 2 1 0 the rest 18 20 18 16 day length 16 14 Day Length & Temperature 14 12 12 10 10 8 8 temperature 6 6 6 5 4 Silicates 3 2 1 0 Onset of flooding 1st shift: Winter (Dec) 2nd shift: Spring (Mar)
Temporal succession 1st shift: Winter (Dec) 2nd shift: Spring (Mar) Onset of flooding
Conclusions • Cryptophytes and pennate diatoms were the most widespread groups in turloughs; • Succession follows a common pattern in the majority of turloughs: filamentous • algae are important in early and later stages of flooding; they are more abundant • in turloughs with high P; • Taxa found in turloughs generally match their known ecological affinities; • Season and TP are the most important explanatory variables in the majority of • turloughs.
Acknowledgments NPWS Norman Allott Catherine Coxon Owen Naughton Mark Kavanagh Gwendolin Porst Sarah Kimberley Nova Shakey Steve Waldren + many others for inspiration and support!
Acknowledgments And of course… the algae and all living beings that made this work possible!
Environmental drivers of community structure 1.0 -0.4 -0.6 0.8 flooded 12.3% of species variability 71.7% of species-environment relation
Environmental drivers of community structure temperature silicates nr days flooded
Differences between turloughs high TP low TP coloured 24800 0 • High TP – more filamentous green algae and more green algae • (log sum and percentage biovolume t-test, p≤0.01) • Low TP – higher relative abundance of Cryptophytes • (log percentage of biovolume of algal groups, t-test, p<0.04)
Turlough distribution Distribution of 304 turloughs (Geological Survey Ireland karst database)
Aims: • To describe phytoplankton communities across 22 turloughs and over time • To interpret the results based on what is known on phytoplankton ecology • To discriminate the main environmental drivers of phytoplankton community • structure