Download
1 / 20
200 likes | 374 Views
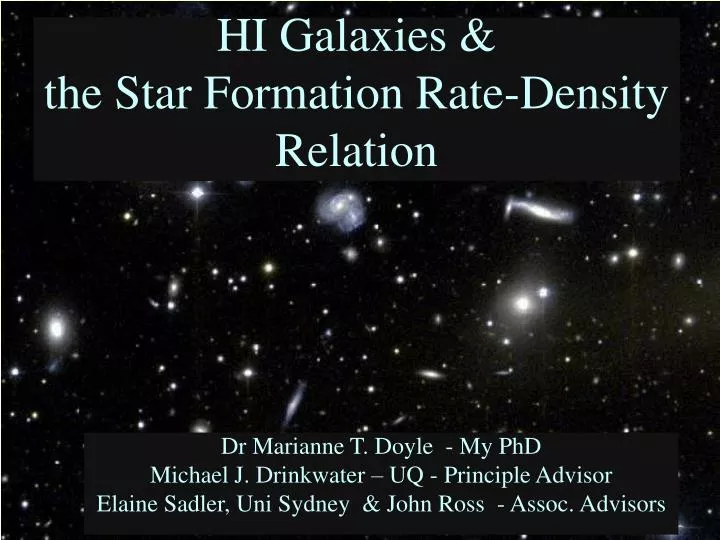
HI Galaxies & the Star Formation Rate-Density Relation. Dr Marianne T. Doyle - My PhD Michael J. Drinkwater – UQ - Principle Advisor Elaine Sadler, Uni Sydney & John Ross - Assoc. Advisors. Content. Morphology-Density & Star Formation Rate-Density Relations

E N D
HI Galaxies & the Star Formation Rate-Density Relation Dr Marianne T. Doyle - My PhD Michael J. Drinkwater – UQ - Principle Advisor Elaine Sadler, Uni Sydney & John Ross - Assoc. Advisors
Content • Morphology-Density & Star Formation Rate-Density Relations • A New way to Investigating the SFR-Density Relation - HI Galaxy Sample • HI Parkes All Sky Survey Optical Catalogue HOPCAT • Results • Conclusions • What Next? ASA Scientific Meeting 1 – 5th July, 2007 Macquarie University, Sydney
In The Beginning……… Morphology -Density Relation Dressler et al. (1980) SFR -Density Relation Lewis et al (2002) ASA Scientific Meeting 1 – 5th July, 2007 Macquarie University, Sydney
My PhD Project • Past studies are based on optical samples • Different Investigation of SFR-Density Relation - HI Galaxies Sample to answer the question: Are there fewer HI “star forming” galaxies in regions of high galaxy density OR Are there physical processes that directly suppresses star formation in these galaxies? ASA Scientific Meeting 1 – 5th July, 2007 Macquarie University, Sydney
HICAT Information Centred on HICAT positions Local Galaxy Density • 3D Local Galaxy Density → No Redshifts → Not Possible • 2D - Local Surface Density – Σ10 • HIPASS Catalogue (HICAT) Optical Catalogue - HOPCAT • Reliable radio-optical galaxy matches ASA Scientific Meeting 1 – 5th July, 2007 Macquarie University, Sydney
Star Formation Rate & Efficiency • Star Formation Rate – SFR • Infrared Fluxes from IRAS • Radio Fluxes from SUMSS & NVSS • Star Formation Efficiency - SFE ASA Scientific Meeting 1 – 5th July, 2007 Macquarie University, Sydney
SFR-Density Relation Infrared SFRs SFR-Density Relation Radio SFRs ASA Scientific Meeting 1 – 5th July, 2007 Macquarie University, Sydney
SCosGC-SUMSS/NVSS 339 galaxies 6dF2MASS-IRAS 1180 galaxies SFR-Density Relation Infrared SFRs Separated into 1000 km s-1 Velocity Ranges SFR-Density Relation Radio SFRs Separated into 1000 km s-1 Velocity Ranges ASA Scientific Meeting 1 – 5th July, 2007 Macquarie University, Sydney
SCosGC-SUMSS/NVSS 339 galaxies 6dF2MASS-IRAS 1180 galaxies SFE-Density Relation Infrared SFEs Separated into 1000 km s-1 Velocity Ranges SFE-Density Relation Radio SFEs Separated into 1000 km s-1 Velocity Ranges ASA Scientific Meeting 1 – 5th July, 2007 Macquarie University, Sydney
Optical • vs. • Radio • Samples • KS test confirms 2 populations are different ASA Scientific Meeting 1 – 5th July, 2007 Macquarie University, Sydney
Comparing SFR vs. Σ10 Results ASA Scientific Meeting 1 – 5th July, 2007 Macquarie University, Sydney
Conclusion • So…….. • SFR & SFE of HI Galaxies does not depend on Σ10 • Population of HI galaxies decreases with increasing Σ10compared to past optical samples There are fewer HI star-forming galaxies in regions with increasing local surface density. • It is the HI galaxy population that decreases, not their SFR, with increasing local surface density. • Confirming the Morphology-Density Relation. • Previous SFR-Density Relation results are due to the optical data samples used. ASA Scientific Meeting 1 – 5th July, 2007 Macquarie University, Sydney
PhD completed! (Sigh of relief) Wish List for Post Doctoral Research? • Star Formation in Galaxies &/or Galaxy Groups/Clusters. • Intergalactic galaxy/cluster research. • SKA/Radio Astronomy. • Multi-wavelength extragalactic research. • Optical Astronomy. • To be or not to be a Dark Galaxy…….. ASA Scientific Meeting 1 – 5th July, 2007 Macquarie University, Sydney
EXTRA SLIDES ASA Scientific Meeting 1 – 5th July, 2007 Macquarie University, Sydney
Original HICAT parameters SuperCOSMOS Image Centred on HICAT positions 6dF & NED velocities A New way to Investigating the SFR-Density Relation – HI Galaxies • HI Galaxy Sample - HOPCAT • Optical Catalogue based on the HI Parkes All Sky Survey Catalogue (HICAT) ASA Scientific Meeting 1 – 5th July, 2007 Macquarie University, Sydney
Local Galaxy Density Problems? • No redshifts – Fore & Background galaxy contamination? • Arbitrary MBjbright & faint limits (-21&-17mags respectively) • Correspondingmbjlimits calculated using target galaxies velocity • Only use galaxies with this range of mbj • Density Corrections for edge affects • > 50% edge affected - galaxy removed • Density Corrected • Northern & Galactic Plane edge affected – trigonometry • SMC & LMC edge affected – Monte Carlo integral method ASA Scientific Meeting 1 – 5th July, 2007 Macquarie University, Sydney
Star Formation Rate & Efficiency Radio & Infrared Fluxes • Infrared Fluxes from IRAS • Radio Fluxes from SUMSS & NVSS ASA Scientific Meeting 1 – 5th July, 2007 Macquarie University, Sydney
Data Sets Fluxes HOPCAT-SCosGC HOPCAT-6dF2MASS SFR vs MHI (vel<10000 km s-1) IRAS 1405 1405 SUMSS 340 340 SN6I 221 221 Σ10 Plots ( 1000<vel<6000 km s-1) IRAS 923 1180 SUMSS 172 275 SN6I 167 203 ASA Scientific Meeting 1 – 5th July, 2007 Macquarie University, Sydney
HI Mass vs. SFR But is this to good to be true? Flux Limited Sample? ASA Scientific Meeting 1 – 5th July, 2007 Macquarie University, Sydney
HI Mass vs. SFR Separated into 1000 km s-1 Velocity Ranges ASA Scientific Meeting 1 – 5th July, 2007 Macquarie University, Sydney