Download
1 / 13
160 likes | 567 Views
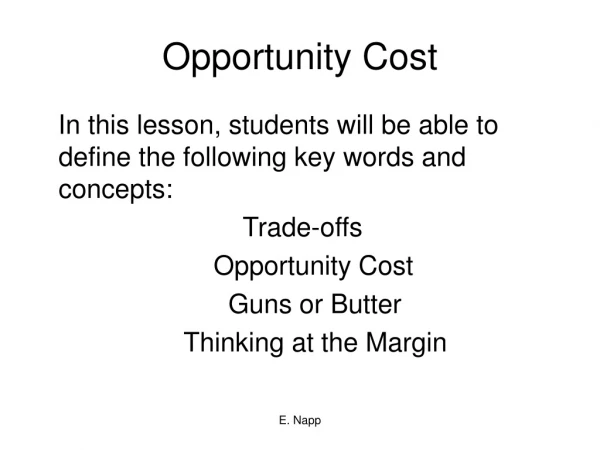
Opportunity Cost (Ch.1-2). Does every decision you make involve trade-offs? How can a decision-making grid help you identify the opportunity cost of a decision? How will thinking at the margin affect decisions you make?. Trade-offs and Opportunity Cost.

E N D
Opportunity Cost (Ch.1-2) • Does every decision you make involve trade-offs? • How can a decision-making grid help you identify the opportunity cost of a decision? • How will thinking at the margin affect decisions you make?
Trade-offs and Opportunity Cost • Trade-offs are all the alternatives that we give up whenever we choose one course of action over others. • The most desirable alternative given up as a result of a decision is known as opportunity cost. All individuals and groups of people make decisions that involve trade-offs.
Karen’s Decision-making Grid Alternatives Sleep late Wake up early to study Benefits • Enjoy more sleep • Have more energy during the day • Better grade on test • Teacher and parental approval • Personal satisfaction Decision • Sleep late • Wake up early to study for test Opportunity cost • Extra study time • Extra sleep time Benefits forgone • Better grade on test • Teacher and parental approval • Personal satisfaction • Enjoy more sleep • Have more energy during the day The Decision-Making Grid • Economists encourage us to consider the benefits and costs of our decisions.
Options 1st hour of extra study time 2nd hour of extra study time 3rd hour of extra study time Benefit Grade of C on test Grade of B on test Grade of B+ on test Opportunity Cost 1 hour of sleep 2 hours ofsleep 3 hours of sleep Thinking at the Margin • When you decide how much more or less to do, you are thinking at the margin.
Cost Review • Measure of sacrifice. • Cost of resource is explained by demand. • Value comes from desired uses of that resource. • Cost=human evaluation (Tullips)
Opportunity Cost Review • Opportunities forgone: What you have given up to get something. • Money is NOT a cost!!!!!!!!!!!!! • Way to measure cost. • No money needs to exchange for there to be a cost (free checking). • Look at what is given up, not how much $ changed hands. • SUNK COST: Once a resource is used and can’t be recovered, it is no longer a cost, because it is no longer a factor in future decisions (pay consequences). (Tickets)
Sunk vs. Opportunity Cost • Know consequences of decisions, don’t be dominated by sunk costs. • Bad buy=cut loss right away (businesses try to minimize losses) • Nobody sells below cost, because of opportunity costs, either you gain something or lose all. • Free: No scarcity, no cost (does not exist). • Gratuitous: No monetary cost, but there are costs. • External Cost: A cost YOU don’t bear by your decisions, but others do. • Marginal Cost: Extra or additional cost when an additional unit is produced
Production Possibilities Graphs (Ch.1-3) • What do you do with the resources you have? • What is a production possibilities graph? • How do production possibilities graphs show efficiency, growth, and cost? • Why are production possibilities frontiers curved lines?
Production Possibilities Graph 25 20 15 10 5 Watermelons (millions of tons) Shoes(millions of pairs) 0 15 a (0,15) 8 14 b (8,14) 14 18 20 21 12 9 5 0 Shoes (millions of pairs) c (14,12) d (18,9) e (20,5) A production possibilities frontier f (21,0) 0 5 10 15 20 25 Watermelons (millions of tons) Production Possibilities • A production possibilities graph shows alternative ways that an economy can use its resources. • The production possibilities frontier is the line that shows the maximum possible output for that economy.
Production Possibilities Graph 25 20 15 10 5 S Shoes (millions of pairs) a (0,15) b (8,14) c (14,12) g (5,8) d (18,9) A point of underutilization e (20,5) f (21,0) 0 5 10 15 20 25 Watermelons (millions of tons) Efficiency • Efficiency means using resources in such a way as to maximize the production of goods and services. An economy producing output levels on the production possibilities frontier is operating efficiently.
Production Possibilities Graph 25 20 15 10 5 Future production Possibilities frontier T S a (0,15) Shoes (millions of pairs) b (8,14) c (14,12) d (18,9) e (20,5) f (21,0) 0 5 10 15 20 25 Watermelons (millions of tons) Growth • Growth If more resources become available, or if technology improves, an economy can increase its level of output and grow. When this happens, the entire production possibilities curve “shifts to the right.”
Production Possibilities Graph 25 20 15 10 5 Watermelons (millions of tons) Shoes(millions of pairs) 0 15 8 14 c (14,12) 14 18 20 21 12 9 5 0 Shoes (millions of pairs) d (18,9) 0 5 10 15 20 25 Watermelons (millions of tons) Cost • Cost A production possibilities graph shows the cost of producing more of one item. To move from point c to point d on this graph has a cost of 3 million pairs of shoes.
Increasing Production Possibilities Curves • A. More Productive Labor Force. • B. Improve quality and quantity of capital. • C. Improve quality and quantity of natural resources. • D. Improve health and education of labor. • E. Improve technology.