Download
1 / 1
10 likes | 96 Views
This is 96 point Futura. Ezra Koenig 1 and Joe Strummer 2 vampireweekend@gmail.com, thewebprincess@strummernews.com 1 WHOI, Cape Cod, Kwassa Kwassa 2 Rutgers, the State University of New Jersey University, New Brunswick, NJ USA. ROMS: http://www.myroms.org.

E N D
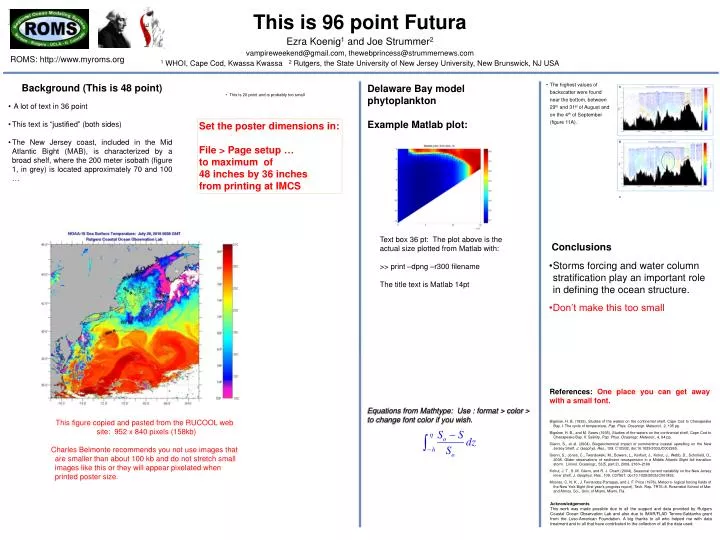
This is 96 point Futura Ezra Koenig1 and Joe Strummer2 vampireweekend@gmail.com, thewebprincess@strummernews.com 1 WHOI, Cape Cod, Kwassa Kwassa 2 Rutgers, the State University of New Jersey University, New Brunswick, NJ USA ROMS: http://www.myroms.org • The highest values of backscatter were found near the bottom, between 29th and 31st of August and on the 4th of September (figure 11A). Background (This is 48 point) Delaware Bay model phytoplankton Example Matlab plot: A • This is 20 point and is probably too small • A lot of text in 36 point • This text is “justified” (both sides) • The New Jersey coast, included in the Mid Atlantic Bight (MAB), is characterized by a broad shelf, where the 200 meter isobath (figure 1, in grey) is located approximately 70 and 100 … Set the poster dimensions in: File > Page setup … to maximum of 48 inches by 36 inchesfrom printing at IMCS B C Text box 36 pt: The plot above is the actual size plotted from Matlab with: >> print –dpng –r300 filename The title text is Matlab 14pt Conclusions • Storms forcing and water column stratification play an important role in defining the ocean structure. • Don’t make this too small References: One place you can get away with a small font. Equations from Mathtype: Use : format > color > to change font color if you wish. This figure copied and pasted from the RUCOOL web site: 952 x 840 pixels (158kb) Charles Belmonte recommends you not use images that are smaller than about 100 kb and do not stretch small images like this or they will appear pixelated when printed poster size. Bigelow, H. B. (1933), Studies of the waters on the continental shelf, Cape Cod to Chesapeake Bay. I. The cycle of temperature, Pap. Phys. Oceanogr. Meteorol., 2, 135 pp. Bigelow, H. B., and M. Sears (1935), Studies of the waters on the continental shelf, Cape Cod to Chesapeake Bay. II. Salinity, Pap. Phys. Oceanogr. Meteorol., 4, 94 pp. Glenn, S., et al. (2004), Biogeochemical impact of summertime coastal upwelling on the New Jersey Shelf, J. Geophys. Res., 109, C12S02, doi:10.1029/2003JC002265. Glenn, S., Jones, C., Twardowski, M., Bowers, L., Kerfoot, J., Kohut, J., Webb, D., Schofield, O., 2008. Glider observations of sediment resuspension in a Middle Atlantic Bight fall transition storm. Limnol. Oceanogr., 53(5, part 2), 2008, 2180–2196 Kohut, J. T., S. M. Glenn, and R. J. Chant (2004), Seasonal current variability on the New Jersey inner shelf, J. Geophys. Res., 109, C07S07, doi:10.1029/2003JC001963. Moores, C. N. K., J. Fernandez-Partagas, and J. F. Price (1976), Meteoro- logical forcing fields of the New York Bight (first year’s progress report), Tech. Rep. TR76–8, Rosenstiel School of Mar. and Atmos. Sci., Univ. of Miami, Miami, Fla. Acknowledgements This work was made possible due to all the support and data provided by Rutgers Coastal Ocean Observation Lab and also due to IMAR/FLAD Tenore-Saldanha grant from the Luso-American Foundation. A big thanks to all who helped me with data treatment and to all that have contributed to the collection of all the data used.