Download
1 / 23
230 likes | 356 Views
Introduction to Monte-Carlo Simulation Experiments. On Uncertainty and Decision-Making….

E N D
On Uncertainty and Decision-Making… "Uncertainty is the most difficult thing about decision-making. In the face of uncertainty, some people react with paralysis, or they do exhaustive research to avoid making a decision. The best decision-making happens when the mental environment is focused. …That fined-tuned focus doesn’t leave room for fears and doubts to enter. Doubts knock at the door of our consciousness, but you don't have to have them in for tea and crumpets." -- Timothy Gallwey, author of The Inner Game of Tennis and The Inner Game of Work.
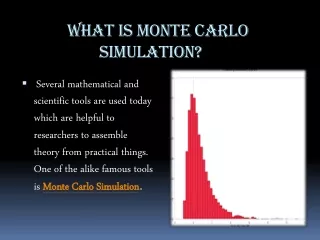
Introduction to Simulation • In many spreadsheets, the value for one or more cells representing independent variables is unknown or uncertain. • As a result, there is uncertainty about the value the dependent variable will assume: Y = f(X1, X2, …, Xk) • Simulation can be used to analyze these types of models.
Random Variables & Risk • A random variable is any variable whose value cannot be predicted or set with certainty. • Many “input cells” in spreadsheet models are actually random variables. • the future cost of raw materials • future interest rates • future number of employees in a firm • expected product demand • Decisions made on the basis of uncertain information often involve risk. • “Risk” implies the potential for loss.
Why Analyze Risk? • Plugging in expected values for uncertain cells tells us nothing about the variability of the performance measure we base decisions on. • Suppose an $1,000 investment is expected to return $10,000 in two years. Would you invest if... • the outcomes could range from $9,000 to $11,000? • the outcomes could range from -$30,000 to $50,000? • Alternatives with the same expected value may involve different levels of risk.
Additional Uses of Simulation • Simulation is used to describe the behavior, distribution and/or characteristics of some bottom-line performance measure when values of one or more input variables are uncertain. • Often, some input variables are under the decision makers control. • We can use simulation to assist in finding the values of the controllable variables that cause the system to operate optimally. • The following examples illustrate this process.
Methods of Risk Analysis • Best-Case/Worst-Case Analysis • What-if Analysis • Simulation
Best-Case/Worst-Case Analysis • Best case - plug in the most optimistic values for each of the uncertain cells. • Worst case - plug in the most pessimistic values for each of the uncertain cells. • This is easy to do but tells us nothing about the distribution of possible outcomes within the best and worst-case limits.
worst case best case worst case best case worst case best case worst case best case Possible Performance Measure Distributions Within a Range
What-If Analysis • Plug in different values for the uncertain cells and see what happens. • This is easy to do with spreadsheets. • Problems: • Values may be chosen in a biased way. • Hundreds or thousands of scenarios may be required to generate a representative distribution. • Does not supply the tangible evidence (facts and figures) needed to justify decisions to management.
Simulation • Resembles automated what-if analysis. • Values for uncertain cells are selected in an unbiased manner. • The computer generates hundreds (or thousands) of scenarios. • We analyze the results of these scenarios to better understand the behavior of the performance measure. • This allows us to make decisions using solid empirical evidence.
Simulation • To properly assess the risk inherent in the model we need to use simulation. • Simulation is a 4 step process: 1) Identify the uncertain cells in the model. 2) Implement appropriate RNGs for each uncertain cell. 3) Replicate the model n times, and record the value of the bottom-line performance measure. 4) Analyze the sample values collected on the performance measure.
What is Crystal Ball? • Crystal Ball is a spreadsheet add-in that simplifies spreadsheet simulation. • A 120-day trial version of Crystal Ball is on the CD-ROM accompanying this book. • It provides: • functions for generating random numbers • commands for running simulations • graphical & statistical summaries of simulation data • For more info see:http://www.decisioneering.com
Random Number Generators (RNGs) • A RNG is a mathematical function that randomly generates (returns) a value from a particular probability distribution. • We can implement RNGs for uncertain cells to allow us to sample from the distribution of values expected for different cells.
Discrete vs. Continuous Random Variables • A discrete random variable may assume one of a fixed set of (usually integer) values. • Example: The number of defective tires on a new car can be 0, 1, 2, 3, or 4. • A continuous random variable may assume one of an infinite number of values in a specified range. • Example: The amount of gasoline in a new car can be any value between 0 and the maximum capacity of the fuel tank.
Some of the RNGs Provided By Crystal Ball Distribution RNG Function Binomial CB.Binomial(p,n) Custom CB.Custom(range) Gamma CB.Gamma(loc,shape,scale,min,max) Poisson CB.Poisson(l) Continuous Uniform CB.Uniform(min,max) Exponential CB.Exponential(l) Normal CB.Normal(m,s,min,max) Triangular CB.Triang(min, most likely, max)
The Uncertainty of Sampling • The replications of our model represent a sample from the (infinite) population of all possible replications. • Suppose we repeated the simulation and obtained a new sample of the same size. Q: Would the statistical results be the same? A: No! • As the sample size (# of replications) increases, the sample statistics converge to the true population values. • We can also construct confidence intervals for a number of statistics...
Constructing a Confidence Interval for the True Population Mean where: Note that as n increases, the width of the confidence interval decreases.
Constructing a Confidence Interval for the True Population Proportion where: Note again that as n increases, the width of the confidence interval decreases.
Random Number Seeds • RNGs can be “seeded” with an initial value that causes the same series of “random” numbers to generated repeatedly. • This is very useful when searching for the optimal value of a controllable parameter in a simulation model (e.g., # of seats to sell). • By using the same seed, the same exact scenarios can be used when evaluating different values for the controllable parameter. • Differences in the simulation results then solely reflect the differences in the controllable parameter – not random variation in the scenarios used.