Slide Note
0 likes | 0 Views
Water Services Drop Programmes 2023 Reports present comprehensive assessments of drinking water and wastewater systems in South Africa, focusing on infrastructure condition, maintenance, operations, treatment processes, and more. The reports aim to improve water quality, inform stakeholders, recognize compliance, inform regulatory actions, and address shortcomings. Released biennially, the reports assist water service institutions in managing risks and improving services. Detailed national and provincial reports are available for download.

E N D
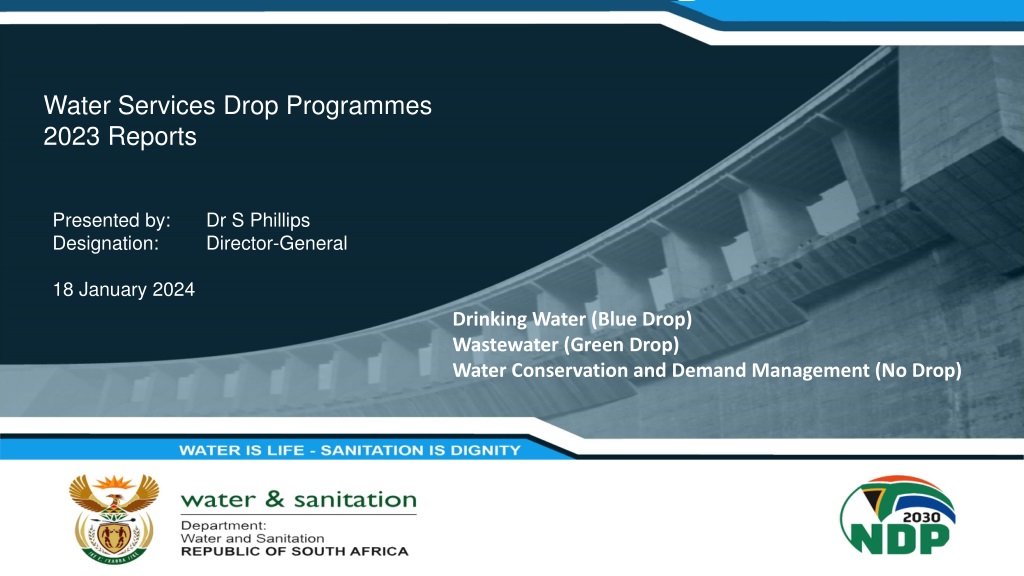
Water Services Drop Programmes 2023 Reports PRESENTATION TITLE Presented by: Designation: Directorate: Name Surname Director Communication Services Presented by: Designation: Dr S Phillips Director-General Date: 15 April 2019 18 January 2024 Drinking Water (Blue Drop) Wastewater (Green Drop) Water Conservation and Demand Management (No Drop)
What the Blue and Green Drop reports focus on • The Green Drop report is a comprehensive assessment of the state of all wastewater treatment systems in South Africa, including municipal, Department of Public Works and private wastewater treatment systems • The Blue Drop report is a similar assessment of the state of all drinking water systems (including Water Treatment Works and municipal water distribution systems) in the country • Both reports cover: o assessments of the condition of the infrastructure o whether the required maintenance is being done on the infrastructure o whether the infrastructure is operated correctly o whether the proper treatment processes are followed o whether proper monitoring and controls are in place o whether the staff have the necessary skills and qualifications 2
What the No Drop report focuses on • The No Drop report is an assessment of the degree to which the drinking water distribution systems of municipalities supply water efficiently, without wasting water • The No Drop assessment covers: o levels of physical water losses in the system (for example through leaks in pipes) o levels of non-revenue water o the average amount of water used per capita per day o whether infrastructure is being maintained properly to minimise wastage o the existence of plans and strategies to reduce water losses; the effectiveness of metering, billing and revenue collection systems 3
Purpose of the Drop reports • DWS carries out the Drop assessments in its role as the Regulator of the water sector, in terms of the National Water Act and the Water Services Act • As the Regulator, DWS has a Constitutional and legislative duty to ensure that national minimum norms and standards are met at municipal level • The five aims of the Drop reports are: 1. To improve municipal drinking water quality, wastewater management as well as water conservation and demand management 2. To keep the public and stakeholders informed and updated with credible data and information about the state of water and sanitation services in the country 3. To recognise water services institutions that achieve compliance and excellence in providing such services. This serves as an incentive for water services institutions to improve their performance 4. To provide DWS with information to inform regulatory actions against non-adherence to standards 5. To identify what needs to be done to address each of the shortcomings identified in the reports o In this regard, the reports are a support mechanism, in addition to being a regulatory mechanism, because they provide the owners of the infrastructure with advice and guidance as to how to improve the services 4
Publication of the reports • Each full or comprehensive drop report is released every two years, with progress assessment reports in alternate years • The Progress Assessment Tool is a risk assessment for each registered treatment works • The full Green Drop was released in 2022, along with Blue Drop progress assessment report • In December 2023, the full Blue Drop and the full No Drop reports were released, along with the Green Drop progress assessment report • The full Blue Drop and Green Drop reports cover the entire system including the distribution or collection network, pumpstations and treatment works for either water or wastewater • The full No Drop report provides an assessment of water losses and non-revenue water in all municipalities in the country 5
Publication of the reports: graphic Compliance against set criteria which includes risk- management Measures the performance and subsequently rewards (or penalises) Water Service Institutions’ performance Incentive- based regulation Drop Full report assessment against KPAs Drop Regulations Programme Progress Assessment Report Allows Water Services Institutions to identify, quantify and manage the risks Assessment of key critical risk areas Risk-based regulation Critical Risk Rating (CRR) 6
Blue Drop 2023 Report Blue Drop 2023 Report Audit year: 1 Jul 2021- 30 Jun 2022 This presentation covers key findings of the 2023 Blue Drop Assessment. The full reports provide more detailed and additional information. The national report and detailed provincial reports are available for download from www.dws.gov.za 7
2022-23 Blue Drop assessment process • All 144 water services authorities (WSAs, i.e. municipalities given the responsibility for water services provision by the Minister of COGTA) were audited during the period 1 July 2021- 30 June 2022 • These WSAs own and operate 958 Water Supply Systems (WSS) (each water services authority is responsible for several different water supply systems) • Most municipalities are provided with bulk water services by the water boards which were also audited • Each WSA and water board was requested to provide information on their performance against all the Blue Drop criteria • All the WSAs and water boards were trained on the criteria and the audit process to be followed and were requested to submit information • DWS then carried out on-site assessments to verify the information provided • Sessions were then organised with all the WSAs and water boards to clarify any anomalies found • Finally, sessions were held with all the WSAs and water boards to give feedback on the results and to indicate what the municipalities and or water boards need to do to improve their performance 8
2022-23 Blue Drop audit coverage Province # Water Services Authorities # Water Supply Systems # Water Treatment Works Eastern Cape (EC) 14 154 222 Free State (FS) 19 80 75 Gauteng (GP) 9 29 19 KwaZulu Natal (KZN) 14 172 190 Limpopo (LP) 10 84 85 Mpumalanga (MP) 17 100 107 Northern Cape (NC) 26 176 158 North West (NW) 10 39 33 Western Cape (WC) 25 144 124 958 126 1,015 Totals SANParks (DFFE) in Mpumalanga 1 13 13 Totals 971 1,028 Note: Water supply systems include both water board and municipal water supply systems. 9
2023 Blue Drop: Key Performance Areas summary KPA and sub-KPAs (contd) KPA 4: TECHNICAL MANAGEMENT 4.a) WTW Design and Supply Capacity Management 4.b) Process Audit 4.c) Water Reticulation Inspection 4.d) Water Treatment and Supply system Asset Management KPA 5: DRINKING WATER COMPLIANCE 5.a) Monitoring Data Submission to DWS 5.b) Acute Health Microbiological Risk Compliance 5.c) Chemical Compliance 5.d) Risk Defined Compliance 5.e) Treatment (Operational) Efficiency Index BONUSES 6.a) Process Control Training 6.b) Performance Agreements 6.c) Publication of Drinking Water Quality Results 6.d) Water Demand Management PENALTIES 7.a) Data variances and Discrepancies 7.b) Non-notification of DWQ Failure Sub-weight 15% 20% 30% 25% 25% 35% 10% 30% 20% 15% 5% KPA and sub-KPAs KPA 1: CAPACITY MANAGEMENT 1.a) Registration of Water Treatment Plant 1.b) Registration of Process Controllers and Supervisor 1.c) Maintenance Capacity 1.d) Engineering Management Capacity 1.e) Scientific Capacity KPA 2: DRINKING WATER QUALITY RISK MANAGEMENT 2.a) Water Safety Planning 2.b) Operational Monitoring 2.c) Compliance Monitoring 2.d) Laboratory Credibility 2.e) Incident Management Protocol KPA 3: FINANCIAL MANAGEMENT Water Treatment Operations and Maintenance Cost Determination done: i) Determined for the whole Water Supply System; or ii) Determined for part of the system; or iii) Not system specific (Global only); or iv) Not Done at all 3.a) Water Supply Operations Cost Determination 3.b) Water Supply Operations & Maintenance Budget 3.c) Water Supply Operations & Maintenance Expenditure 3.d) Supply Chain Management of Services and Treatment Products 3.e) Capital Budget and Expenditure Sub-weight 15% 20% 20% 20% 20% 20% 20% 40% 10% 20% 20% 10% 15% 25% 25% 25% 25% 50% 50% 35% 10% 25% 20% 10 10%
2023 Blue Drop score categorisation The Blue Drop Scores for each water supply system are categorised as follows: >80-<95% Good performance, some room for improvement >50-<80% Average performance, ample room for improvement Poor performance, need targeted intervention towards gradual sustainable improvement Critical state, need urgent intervention for all aspects of the water services business >31-<50% 0-<31% This categorization system is applied to the aggregated score for each water supply system and for each water services authority. 11
2023 Blue Drop scores by province No (%) of systems per Blue Drop score category 2023 No (%) of systems per Blue Drop score category 2014 Total no systems ProvinceTotal no 95–100 Excellent 80-<95 Good 50-80 Average 31-50 Poor 0-31 Critical 95–100 Excellent 80-<95 Good 50-80 Average 31-50 Poor 0-31 Critical systems EC FS 155 79 0 (0%) 6 (8%) 39 (25%) 7 (9%) 53 (34%) 32 (20%) 41 (52%) 20 (25%) 31 (20%) 5 (6%) 154 80 0 (0%) 0 (0%) 6 (4%) 2 (3%) 88 (57%) 33 (21%) 27 (18%) 31 (39%) 16 (20%) 31 (39%) GP 29 9 (31%) 17 (59%) 3 (10%) 0 (0%) 0 (0%) 29 3 (10%) 15 (52%) 8 (28%) 3 (10%) 0 (0%) KZN 209 8 (4%) 16 (8%) 124 (59%) 43 (21%) 18 (9%) 172 3 (2%) 19 (11%) 95 (55%) 34 (20%) 21 (12%) LP 74 1 (1%) 9 (12%) 19 (26%) 23 (31%) 22 (30%) 84 0 (0%) 0 (0%) 44 (52%) 14 (17%) 26 (31%) MP 100 9 (9%) 7 (7%) 33 (33%) 28 (28%) 23 (23%) 100 4 (4%) 9 (9%) 42 (42%) 11 (11%) 34 (34%) NC 173 2 (1%) 13 (8%) 76 (44%) 48 (28%) 34 (20%) 176 0 (0%) 5 (3%) 18 (10%) 30 (17%) 123 (70%) NW 95 1 (1%) 2 (2%) 34 (36%) 26 (27%) 32 (34%) 39 1 (3%) 5 (13%) 13 (33%) 13 (33%) 7 (18%) WC 122 8 (7%) 19 (16%) 61 (50%) 25 (20%) 9 (7%) 124 15 (12%) 47 (38%) 34 (27%) 20 (16%) 8 (6%) 129 (12%) 245 (24%) 174 (18%) Totals 1036 44 (4%) 444 (43%) 174 (17%) 958 26 (3%) 108 (11%) 373 (39%) 277 (29%) The number of water supply systems in 2023 is slightly lower of that assessed in 2014 because some municipalities have merged some of their systems and some boreholes which were assessed in 2014 were not assessed in 2023. 12
2023 Blue Drop: key findings • 26 water supply systems (WSSs) scored more than 95% and qualified for the prestigious Blue Drop Certification. In 2014, 44 WSSs were awarded Blue Drop status An overall decline in excellence is noted between 2014 and 2023 • 277 of 958 (29%) WSSs (in 62 WSAs - see Annexure A) were identified to be in a critical state of performance compared with 174 of 1036 (17%) WSSs (in 33 WSAs) in 2014 An overall increase in the number of systems in a critical state of performance is noted between 2014 and 2023 • Drinking water systems in the major metropolitan areas are generally performing well in terms of the Blue Drop key performance areas • Gauteng has the highest percentage of drinking water systems with excellent or good performance (62%), followed by Western Cape (50%)* • Northern Cape has the highest percentage of drinking water systems with poor or critical performance (87%). This has deteriorated from 48% in 2014 • The percentage of drinking water systems with poor or critical performance in Free State has also deteriorated markedly from 2014 (31%) to 2023 (59%) * Notes: 1. The water supply disruptions which have been experienced in Gauteng in recent months are caused by the demand for treated water occasionally exceeding the available supply of treated water 2. One of the reasons for the good performance of systems in Gauteng is the fact that Rand Water manages the treatment of water and distribution elements of many of the systems in Gauteng 13
2023 Blue Drop: critically performing systems 2014 WSSs in a critical state of performance (<31%) 31 2023 WSSs in a critical state of performance (<31%) 27 2023 WSAs with systems in a critical state of performance 5 Province Eastern Cape Free State 5 31 9 Gauteng None None None KwaZulu Natal 18 21 4 Limpopo 22 26 Mpumalanga 23 34 8 Northern Cape 34 123 22 North West 32 7 3 Western Cape 9 8 4 61 Totals 174 277 14
2023 Blue Drop analysis: pie charts 2014 Blue Drop Assessment Results (water supply systems) 2023 Blue Drop Assessment Results (water supply systems) 44 26 174 108 129 277 245 373 444 174 >95 – 100% Excellent >80-<95% Good >50-<80% Average 31-<50% Poor 0-<31% Critical state 15
2023 Blue Drop scores: map • 144 WSAs & 958 systems audited • 7 Water Boards audited • 26 Blue Drop Certifications • 277 systems found to be in a critical state of performance >95-100% Excellent situation >80-<95% Good performance >50-<80% Average performance >31-<50% Very poor performance 16 0-<31% Critical state
2023 Blue Drop: findings regarding drinking water quality • Based on water quality tests carried out by municipalities themselves during the 2021/2022 municipal financial year (2014 figures in brackets): 54% of systems achieved excellent or good, 46% poor or bad microbiological water quality compliance (5% in 2014) 76% of systems achieved excellent or good, 24% of systems unacceptable chemical water quality compliance (15% in 2014) • The overall performance trend indicates a severe regression from 2014 to 2023, especially with regard to microbiological compliance • • Drinking water quality is generally good in the major metropolitan areas During the audit period, 14 water service authorities (see Annexure B) did not report water quality data to the Department or provide any other evidence that they have been testing their water quality: • The Department issued non-compliance notices to those municipalities instructing them to issue advisory notices to their residents that their water might not be safe to drink if it has not been properly tested • DWS followed up with these WSAs and some of them indicated that they are in the process of appointing laboratories, others commenced with sampling, and others provided evidence of testing and achieving drinking water quality • Where necessary these WSAs did issue advisory notices 17
2023 Blue Drop Drinking Water Quality: performance of water supply systems Microbiological Compliance Chemical Compliance Unacceptable, 229, 24% Excellent, 475, 49% Unacceptable 442; 46% Good, 13, 1% Excellent; 708; 75% Good, 49, 5% Excellent Good Unacceptable Excellent Good Unacceptable 18
Implications of 2023 Blue Drop drinking water quality findings • According to the South African Bureau of Standards (SANS 241 which is informed by World Health Organisation Guidelines), it is not safe to drink water if less than 97% of tests for microbiological contaminants and chemical compliance conducted over a year comply with water quality standards • It was therefore not microbiologically safe to drink the water in almost half (46%) of our drinking water systems at times during 2022 when the Blue Drop audit was done, which resulted in increased risk of life-threatening water-borne diseases such as cholera and chronic diarrhoea • The Blue Drop report does not provide an indication of the current status of water quality in municipalities • In terms of SANS241 and the norms and standards issued by DWS under the Water Services Act, when the tests carried out by a municipality indicate that the water supplied poses a health risk, the municipality must inform its consumers that the quality of the water that it supplies poses a health risk • DWS has sent non-compliance letters to the municipalities having systems with poor or bad compliance in the 2023 Blue Drop Report. These letters require the municipalities to inform their residents should they still have poor or bad compliance • The public can safely consume water from their taps if their municipalities indicate that the water being provided is being tested and meets the requirements of SANS 241 – residents should check with their municipalities if this is the case • The department provides monthly water quality data received from municipalities on its Integrated Regulatory Information System webpage that can be accessed at ws.dws.gov.za/iris/mywater.aspx 19
2023 Blue Drop: drinking water infrastructure condition • Of 151 systems (at least 1 per WSA and Water Board) physically assessed: o 3% of the sampled systems were found to be in a critical infrastructural condition, 12% in a poor infrastructural condition o 49% in an average infrastructural condition o 31% in good condition, and 5% in an excellent condition • The fact that 85% of drinking water systems were in an average or better infrastructure condition indicates that non- infrastructure factors such as a lack of skilled staff or a lack of proper process controls are as important as infrastructure condition, if not more important, as contributors to poor drinking water quality • The 2022 Green Drop report found municipal wastewater collection and treatment infrastructure to be in a worse condition (only 44% in an average or better infrastructure condition), indicating a reluctance of municipal councils to budget for maintenance of wastewater infrastructure in particular 20
2023 Blue Drop: technical competence ‘Technical competence’ assesses the technical human resources capacity that is available to manage and operate water treatment processes and maintain the related water infrastructure # Available staff with required qualifications Process Controllers 293 154 128 294 235 319 52 79 272 1,826 # Required Staff Staff Shortfall # # Province WTWs WSSs Process Controllers 700 276 154 615 439 451 370 110 415 3530 Process Controllers 407 (58%) 122 (44%) 26 (17%) 321 (52%) 114 (26%) 132 (29%) 318 (86%) 31 (28%) 143 (34%) 1,614 Supervisors Supervisor Supervisors EC FS GP KZN LP MP NC NW WC Totals • Gauteng has the highest percentage of drinking water systems with excellent or good performance and the lowest shortfall of qualified staff • Northern Cape has the highest percentage of drinking water systems with poor or critical performance and the highest shortfall of qualified staff 222 75 19 190 85 107 158 33 126 1,015 154 80 29 172 84 100 176 39 124 958 276 72 42 154 46 165 75 33 247 1110 265 58 42 143 35 143 52 29 230 997 11 (4%) 14 (19%) 0 (0%) 11 (7%) 11 (24%) 12 (7%) 23 (30%) 4 (12%) 17 (7%) 103 21
2023 No Drop Report 2023 No Drop Report Audit year: 1 Jul 2021- 30 Jun 2022 The report is available for download from www.dws.gov.za 22
2023 No Drop: introduction • As indicated earlier, the No Drop Programme assesses the degree to which the drinking water distribution systems of municipalities supply water efficiently, without wasting water • No Drop assessment covers: o Levels of physical water losses in the system (for example through leaks in pipes) o Levels of non-revenue water o Amount of water used per capita per day o Whether infrastructure is being maintained properly to minimise wastage o Existence of plans and strategies to reduce water losses o Effectiveness of metering, billing and revenue collection systems • All 144 Water Services Authorities were audited during the period 1 July 2021- 30 June 2022 • The Department trained the WSAs on the scope and the criteria for the audit cycle • WSAs provided information which was verified by the Department 23
2023 No Drop: terminology • Non-Revenue Water (NRW) is treated water that is bought or produced by the municipality for which the municipality gets no revenue • NRW is caused by: o Physical losses e.g. water leaking out of pipes above or underground o Poorly functioning or non-existent water meters o Illegal connections o Poor billing and revenue collection • Why is NRW a problem? o A huge amount of money has to be spent to develop dams to capture and store raw water, and to develop and operate water treatment works to treat the water. This money is wasted if that water is thrown away through leaks o Municipalities buy treated water from Water Boards. If municipalities do not get revenue from that water, then they cannot pay the Water Boards. If Water Boards don’t get paid, they can’t treat water anymore o If municipalities don’t collect the revenue they are supposed to collect, then they cannot afford to maintain and operate the infrastructure o South Africa is a water scarce country and every drop counts! We cannot afford to throw treated water away through leaks 24
2023 No Drop: key findings • 4 WSAs scored more than 90% and qualified for the prestigious No Drop Certification • In 2014, 44 WSAs were awarded No Drop status An overall decline in excellence is noted between 2014 and 2023 • 8 WSAs scored between 80 and <90%, which is good performance • 64 WSAs scored below 30% (see Annexure C) • The total volume of water treated for municipal use is 4.4 billion m3/annum. Of this, 2.1 billion m3/annum (47%) is estimated to be non-revenue water (NRW). NRW was 37% in the 2014 No Drop report • The international average for non-revenue water is 30% • The national trends suggest that average per capita water consumption is approximately 218 litres/capita/day compared to the international average of 173 l/c/d. This is an anomaly given that South Africa is a water scarce county • The high level of physical losses in municipal distribution systems is one of the main reasons for the relatively high level of per capita consumption in South Africa • Poor operation and maintenance of infrastructure leads to unacceptably high physical losses • In order to reduce non-revenue water, municipalities need to improve operation and maintenance of their infrastructure; repair leaks; improve metering, billing, revenue collection, and debtor management; improve pressure management; and engage in community education and awareness; amongst other measures 25
2023 No Drop: map • • • 144 WSAs audited 4 No Drop Certifications 64 critical state WSAs >90-100% Excellent situation >80-<90% Good performance >50-<80% Average performance >30-<50% Poor performance 0-<30% Critical state 26
2023 No Drop: percentage NRW per WSA Province % NRW EC 50.6 FS 59.5 GP 49.2 KZN 60.5 MP 54.9 LP 57.7 NC 49.0 NW 55.6 WC 27.6 National 47.4 The high levels of NRW, including physical losses, in GP and KZN are one of the reasons for water supply disruptions that have been experienced there 27
2023 No Drop: average litres per capita per day (l/c/d) water consumption per WSA Province l/c/d EC 180 FS 196 GP 279 KZN 187 MP 179 LP 197 NC 193 NW 167 WC 164 National 218 • The high level of consumption in Gauteng is one of the reasons why the demand for treated water in Gauteng is occasionally exceeding the available supply • The low NRW and low average level of consumption in Western Cape may be partly a result of the effective water conservation and demand management programme implemented by the City of Cape Town to avoid Day Zero 28
2023 Green Drop Progress 2023 Green Drop Progress Assessment Report Assessment Report Audit year: 1 Jul 2021- 30 Jun 2022 The Report is available for download from www.dws.gov.za 29
2023 Green Drop: introduction • As indicated earlier, the Green Drop Progress Report focuses on wastewater treatment works (WWTWs) (the full Green Drop report, released in 2022 is more comprehensive and covers the sewer collection networks and pumpstations as well as the wastewater treatment works) • The progress assessment report covers WWTW in: o 144 Water Services Authorities (867 WWTWs) o The Department of Public Works (107 WWTWs) o Eskom, Nedbank, Sasol and San Parks (29 WWTWs) • Each WWTW was assessed in terms of: o Whether the plant has the capacity to process the amount of sewage going into it o Whether the WWTW have the required staff with the necessary qualifications and experience to properly operate and maintain the plants o Whether the plants meet the statutory requirements for the quality of the effluent coming out of the plants • Each WWTW was categorised in terms of the risk that it poses, in terms of the risk of putting partially treated or untreated wastewater into the environment 30
2023 Green Drop: findings • Results: o 9% of WWTWs are in the low-risk category o 25% of WWTWs are in the medium-risk category o 34% of WWTWs are in the high-risk category, and o 32% of WWTWs are in the critical-risk category • WWTWs in the high risk or critical risk category are resulting in high levels of pollution through discharging partially treated or untreated water into rivers and the environment o This has negative environmental implications and poses risks to human health, e.g. cholera outbreaks are normally associated with wastewater pollution of water resources • Polluted water resources also raise the cost of water treatment • The number of WWTWs in the high- and critical-risk categories have both increased since 2013 31
2023 Green Drop: graphic National Risk profile from 2009 to 2023 298 284 300 278 272 264 262 259 252 232 250 222 217 208 199 196 200 168 No. of WWTPs 138 137 150 129 121 100 74 50 0 50-70 50-70 50-70 50-70 50-70 70-90 70-90 70-90 70-90 70-90 0 - 50 0 - 50 0 - 50 0 - 50 0 - 50 90-100 90-100 90-100 90-100 90-100 2009 2011 2013 2022 2023 2009 2011 2013 2022 2023 2009 2011 2013 2022 2023 2009 2011 2013 2022 2023 32
2023 Green Drop: findings by province • The report provides an average wastewater treatment risk rating per province, based on the risk ratings for WWTWs in that province • None of the provinces have improved their WWTWs risk ratings since 2022 • The provincial risk ratings for WWTWs in Gauteng, KwaZulu-Natal and Western Cape have remained in the medium-risk category since 2022 • The performance of WWTWs in the Northern Cape worsened from high-risk to critical-risk rating between 2022 and 2023. 22% (18/81) of WWTWs in the Northern Cape are in the high-risk category and 74% (60/81) of WWTWs are in the critical-risk category • All other provinces have remained in the high-risk category since 2022 33
2023 Green Drop: findings by province graphic Provincial Risk Rating 2022 and 2023 100% 90% 80% Risk Profile - % CRR/CRRmax 70% 60% 50% 92.4% 89.7% 88.5% 85.4% 85.0% 84.7% 81.4% 81.2% 80.4% 78.7% 74.1% 40% 72.3% 67.9% 65.9% 64.9% 60.3% 58.8% 53.1% 30% 20% 10% 0% Eastern Cape Free State Gauteng KwaZulu Natal Limpopo Mpumalanga North West Northern Cape Western Cape 2022 (left bar) and 2023 (right bar) 34
Underlying main causes of poor performance in terms of the drop reports • Non-adherence to standard operating processes for drinking water treatment and wastewater treatment • Infrastructure in a poor condition due to a lack of maintenance • Underlying causes: Municipalities not hiring the necessary staff with the correct qualifications Non-prioritization of budgets for maintenance and operations by municipal councils Weak billing and revenue collection • Vandalism and metal theft of infrastructure are an increasing cause of infrastructure failure, but this is partly a result of inadequate security being provided by municipalities 36
Support to municipalities • WSAs with water or wastewater systems in a critical state are required to submit detailed corrective action plans to DWS, and are offered support to produce these plans DWS Minister and Deputy Ministers spend most of their time crisscrossing the country visiting those municipalities with severe challenges with water and sanitation services DWS and Water Boards are supporting many of the municipalities to implement improvement plans agreed to by Ministry and municipal leadership DWS works with COGTA, the Municipal Infrastructure Support Agency, the Department of Human Settlements, and National Treasury to provide support to the worst performing municipalities, including: o Allocating infrastructure grants worth more than R20 billion per annum to municipalities o Technical and engineering support and assistance o Capacity building and training o Financial management advice and support National Treasury, DWS, COGTA and DHS need to work together to utilise grant conditions to incentivize improvements in Blue Drop, Green Drop and No Drop scores DWS needs to ensure that all the Water Boards have the necessary capacity to provide support to municipalities, including providing a retail WSP function if requested Municipalities should be provided with support to address the shortage of process controllers. As much as half of the current process shortfall can be addressed by training of existing staff to enable certification, rather than hiring new staff • • • • • • 37
Limits to impact of support to municipalities • Despite all the support being provided to municipalities, the drop reports indicate that water services continue to decline • There are limitations to which national support programmes can turn around the decline: o In those cases where the leadership of the municipality is not responding to directives or not listening to advice or not accepting support, performance can only be improved by addressing the leadership challenges o The main cause of the decline in water services is poor maintenance and operation by municipalities – which must be funded by revenue from the sale of water by municipalities to customers – DWS and COGTA are not allowed to provide funding to municipalities for maintenance and operation o DWS and COGTA are repeatedly providing municipalities with grants to repair infrastructure, which is not maintained by the municipalities, deteriorates again rapidly, and then funding needs to be provided again o National government cannot make decisions to prioritise maintenance and operation funding on behalf of municipalities – these decisions must be made by municipal Councils o National government cannot hire staff on behalf of municipalities – the municipal leadership must prioritise the filling of key technical positions with appropriately skilled staff and budget for this from revenue 38
Grouping of municipalities according to BD and GD scores For the purpose of this Summit, municipalities have been grouped into the following four groups based on their Drop scores: • Group 1: Remain in Assembly Room o Consists of 67 municipalities which scored ‘critical’ on average across their water supply systems and/or wastewater systems in the 2023 full Blue Drop and 2022 full Green Drop assessments • Group 2: Fabia 1 room o Consists of 38 municipalities which scored ‘poor’ on average across their water supply systems and/or wastewater systems in the 2023 full Blue Drop and 2022 full Green Drop assessments • Group 3: Fabia 2 room o Consists of 27 municipalities which scored ‘average’ on average across their water supply systems and/or wastewater systems in the 2023 full Blue Drop and 2022 full Green Drop assessments • Group 4: Julia room o Consists of the 12 municipalities which either scored good or excellent on average across their water supply systems and/or wastewater systems in the 2023 full Blue Drop and 2022 full Green Drop assessments 40
Group Work • After the presentation of the Case study by Ekurhuleni MM, the Summit will break up into these four groups • Each municipality must attend the group to which it is allocated • Water Boards, as support water service providers, are encouraged to attend Groups 1 and 2 • Other stakeholders should choose which group to attend or divide themselves up between the groups • Each group will be facilitated by a senior official from DWS • The DWS official will make a presentation to the group on the BD, GD and ND results specific to that group, analysis of the results, and initial recommendations for what should be done by the municipalities in that group to address the BD, GD and ND results • The groups will deliberate on the presentations and provide inputs • Revised presentations will then be made to plenary, for discussion and further inputs • Post the Summit, DWS will monitor the development and implementation of individual municipal action plans to address the BD, GD, and ND results 41
Guiding questions for the groups Based on the group presentation: 1. Do you agree with the analysis of the causes of good or bad performance? 2. Are there any important causes which have been omitted? 3. Do you agree with the initial recommendations for what should be done by the municipalities in the group to improve performance? 4. Are there any further recommendations to improve performance? 42
Thank You! 43 43
Annexure A: List of water service authorities and their water supply systems in a critical state of performance per province 44
National BD Score (<31% Critical State) Summary WSA Name 2023 Critical State (<31%) WSA Name 2023 Critical State (<31%) Eastern Cape (5 WSA 27 WSS) Alfred Nzo DM Free State (10 WSA 31 WSS) Mafube LM Water Supply Systems Water Supply Systems Kinira Farms & Rural, Hofmeyer and Tarkastad Aberdeen, Graaff-Reinet, Jansenville, Klipplaat, Nieu-Bethesda, Rietbron, Steytlerville, WaterFord, Willowmore and Wolwefontein Blikkiesdorp, Clarkson, Coldstream, Joubetina, Kareedouw, Krakeel, Louterwater, Misgund, Sanddrif, Storms River and Woodlands Addo and Kirkwood Frankfort, Tweeling, Villiers Bluegumbosch, Kestell, Harankopane, Mphatlalatsane, Greater Qwaqwa, Makwane, Harrismith, Tshiame Soutpan Krugersdrift Dam Hobhouse, Tweespruit Brandfort, Theunissen, Verkeerdevlei, Winburg Rouxville, Smithfield, Zastron Steynsrus Parys, Vredefort, Koppies, Edenville boreholes Clocolan, Senekal Boshof, Dealesville Chris Hani DM Maluti-a- Phofung LM Dr Beyers Naude LM Mangaung Mantsopa LM Masilonyana LM Mohokare LM Moqhaka LM Koukamma LM Ngwathe LM Sundays River Valley LM Setsoto LM Tokologo LM 45
National BD Score (<31% Critical State) Summary WSA Name 2023 Critical State (<31%) WSA Name 2023 Critical State (<31%) Mpumalanga (8 WSA 34 WSS) Albert Luthuli LM Dipaleseng LM Emakhazeni LM KwaZulu Natal (4 WSA 21 WSS) Harry Gwala DM King Cetshwayo DM Umzinyathi DM Water Supply Systems Water Supply Systems All 8 WSSs Greater Dipaleseng Belfast, Dullstroom Elandshoek, Hazyview, White River, White River Country & Golf Estates, Mjindini Trust-Madakwa, Rimers-Suid Kaap, Sheba, Mjejane, Legogote, Nyongane River, Dwaleni, Mshadza Rural WSS Breyten, Davel, Douglas dam, Lothair, South works (noitgedacht farm) Coromandel, Graskop, Lydenburg, Sabie Langkloof Machunwini, Chibini Khombe, Pikiliyeza 12 of 13 WSSs Coronation, eMondlo, Hlobane, Louwsberg, Vryheid Zululand DM Limpopo (6 WSA 26 WSS) Bela-Bela LM Water Supply Systems Mbombela/Umjindi Radium, Rapotokwane Alldays, Botlokwa, Mogwadi and Senwabarwana Flag Boshielo, Kutullo, Magukubjane, Mahlokoena, Mapodile, Marishane, Masemola, Ngwaabe, Nkosini, Penge, Steelpoort, Tsakane and Vergelegen Mookgophong, Mabaleng, Mabatlane and Roedtan Drakensig Leeupoort and Rooiberg Capricorn DM Mkhondo LM Greater Sekhukhune DM Msukaligwa LM Modimolle/Mookgo phong LM Mopani DM Thabazimbi LM Thaba Chweu LM Thembisile LM 46
National BD Score (<31% Critical State) Summary WSA Name 2023 Critical State (<31%) WSA Name 2023 Critical State (<31%) Renosterberg LM Richtersveld LM Siyancuma LM Siyathemba LM Tsantsabane LM Ubuntu LM Umsobomvu LM All 3 WSSs All 5 WSSs All 4 WSSs Marydale Skeyfontein All 5 WSSs All 3 WSSs Northern Cape (22 WSA 123 WSS) !Kai! Garib LM !Kheis LM Dikgatlong LM Emthanjeni LM Gamagara LM Ga-Segonyana LM Joe Morolong LM Kamiesberg LM Kareeberg LM Karoo Hoogland LM Kgatelopele LM Khai-Ma LM Magareng LM Water Supply Systems All 16 WSSs Gariep, Grootdrink, Wegdraai Barkley West, Windsorton All 3 WSSs Dibeng 23 of 24 WSSs 17 of 18 WSSs All 16 WSSs All 3 WSSs All 3 WSSs Danielskuil All 4 WSSs Warrenton Buffelsrivier, Carolusberg, Goodhouse, Kommagas, Rooiwal, Vioolsdrift Hartswater, Jan Kempdorp Nama Khoi LM Phokwane LM 47
National BD Score (<31% Critical State) Summary WSA Name 2023 Critical State (<31%) WSA Name 2023 Critical State (<31%) North West (3 WSA 7 WSS) Dr. Ruth S Mompati DM Kgetlengrivier LM Ngaka Modiri Molema DM Western Cape (4WSA 8 WSS) Beaufort West LM Hessequa LM Kannaland LM Prince Albert LM Water Supply Systems Water Supply Systems Bogosing, Majeakgoro, Pudimoe, Schweizer Reneke Murraysburg, Nelspoort Jongensfontein Ladismith, Van Wyksdorp, Zoar Klaarstroom, Prince Albert Koster, Swartruggens Ratlou: Kraaipan Cluster B/H 48
Annexure B: List of water service authorities that failed to provide microbiological water quality information for the Blue Drop audit period 49
Water Service Authorities (WSAs) that failed to provide microbiological water quality information for the BD audit period Name of WSA Name of Water Supply System Name of WSA Name of Water Supply System Kou-Kamma LM (EC) Joubertina, Krakeel Louterwater Misgund Maluti a Phofung LM (FS) Bluegumbosch Supply system Greater QWAQWA Supply System HaRankopane Supply System Harrismith water Supply System Kestell Supply system Makwane water supply system Mphatlalatsane Supply System Tshiame Water Supply System Mafube LM (FS) Frankfort Tweeling Villiers Ngwathe LM (FS) Edenville Boreholes Koppies Supply System Parys Vredefort supply system 50