Download

1 / 50
500 likes | 609 Views
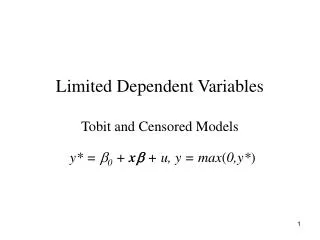
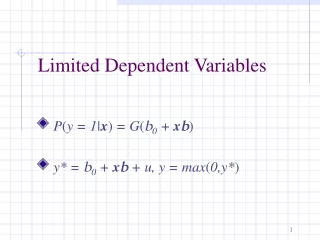
Correlation Indicates the relationship between two dependent variables (x and y) Symbol: r (Pearson correlation coefficient) -1< r < 1. Positive Correlation As value of variable X increases, value of variable Y increases. Strong Positive Corr. r = .80.

E N D
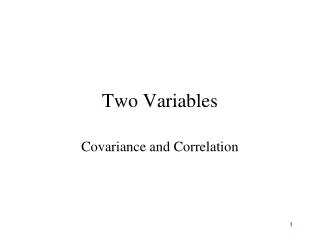
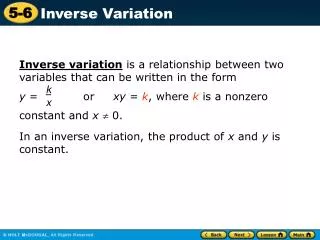
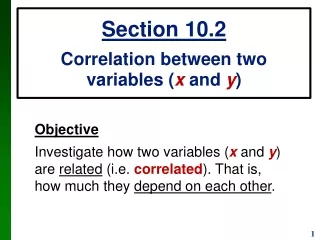
Correlation Indicates the relationship between two dependent variables (x and y) Symbol: r(Pearson correlation coefficient) -1< r < 1
Positive Correlation As value of variable X increases, value of variable Y increases
Strong Positive Corr. r = .80
Strong positive correlation: - low variability of the data - one variable acts as a good predictor of the second variable.
Weaker Positive Corr. r = .50
Weaker correlations: - More variability in the data - Less predictability
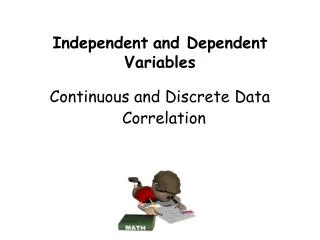
Negative correlation As value of variable X increases, value of variable Y decreases.
Strong negative Corr. r = -.80
Grades Social Activities
No Correlation r = 0 Statistics Ability # of bananas eaten
Variables measured on different scales e.g. Height and weight Correlation formula converts the scores into z-score to make them comparable
Limit of correlation is that it identifies a relationship, but is NOT identifying cause
Multiply each value of X by its corresponding Y. Add the products. Multiply sum by n
Add all the X values. Add all the Y values. Multiply the two sums.
Quiz One Quiz Four (X) (Y) 28 30.5 28 29.5 30 39 29 36.5 21 30.5
Quiz One Quiz Four (X) (Y) 28 30.5 28 29.5 30 39 29 36.5 21 30.5 X = 136 Y = 166
Quiz One Quiz Four (X) X2 (Y) 28 784 30.5 28 784 29.5 30 900 39 29 841 36.5 21 441 30.5 X2 = 3750
Quiz One Quiz Four (X) (Y) Y2 28 30.5 930.25 28 29.5 870.25 30 39 1521 29 36.5 1332.25 21 30.5 930.25 Y2 = 5584
Quiz One Quiz Four (X) (Y) (X)(Y) 28 30.5 854 28 29.5 826 30 39 1170 29 36.5 1058.5 21 30.5 640.5 XY = 4549
X = 136 Y = 166 X2 = 3750 Y2 = 5584 XY = 4549 n = 5
Critical Value: df = n -- 2 r crit. = .878
df Critical r 3 .878 5 .754 10 .576 20 .423 50 .273 100 .195
How much of the variability of X can be accounted for by variability in Y?
r r2 .9 .81 or 81% .8 .64 or 64% .7 .49 or 49%
df Critical r 3 .878 5 .754 10 .576 20 .423 50 .273 100 .195
# of absences test grade 8 35 0 48 3 43 2 41 5 39 6 36 X = 24 Y = 242
# of absences test grade 8 64 35 1225 0 0 48 2304 3 9 43 1849 2 4 41 1681 5 25 39 1521 6 36 36 1296 X2= 138 Y2 = 9876
# of absences test grade 8 35 280 0 48 0 3 43 129 2 41 82 5 39 195 6 36 216 xy = 902