Download
1 / 33
340 likes | 554 Views
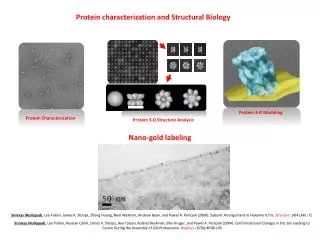
The Future of Structural Biology. 10 Å. Disorder? o r Dynamics?. What is the structure of “disorder” ?. a grand challenge for structural biology in the 21 st century. Promise of Single-molecule Imaging. R. Neutze et al., Nature 406 , pp. 752-757 (2000). lysozyme: thermal motion.

E N D
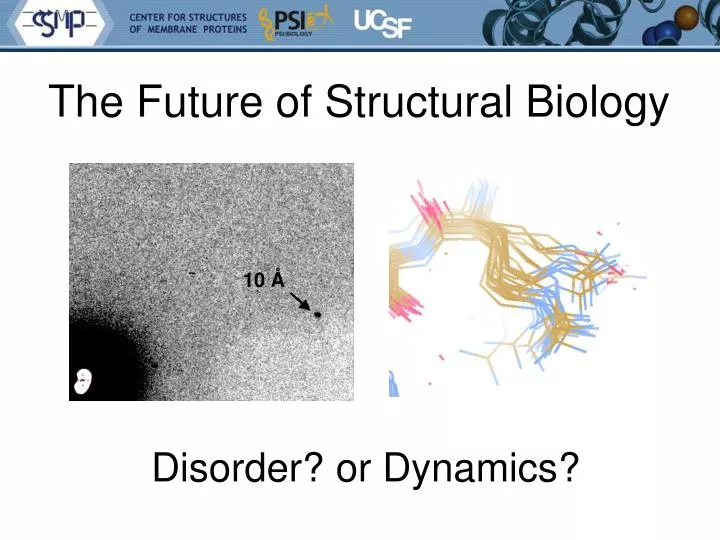
The Future of Structural Biology 10 Å Disorder? or Dynamics?
What is the structure of “disorder” ? a grand challenge for structural biology in the 21st century
Promise of Single-molecule Imaging R. Neutze et al., Nature 406, pp. 752-757 (2000)
lysozyme: thermal motion RMS displacement from B factors
The Future of Structural Biology Problem: XFELs cannot solve the “resolution problem”
Muybridge’s galloping horse (1878) “Time-resolved” diffraction Real space reciprocal
Muybridge’s galloping horse (1878) Average electron density Real space reciprocal
What can we do now? Make the molecule sit still Preserve sample integrity Model the average structure
Make the molecule sit still 20 years of biochemistry How long to find this in a random search? Biophysical assays for rigidity? What about function? What if function and “disorder” are the same thing?
Non-isomorphism in lysozyme RH 84.2% vs 71.9% RMSD = 0.18 Å Riso = 44.5%
Dear James The story of the two forms of lysozyme crystals goes back to about 1964 when it was found that the diffraction patterns from different crystals could be placed in one of two classes depending on their intensities. This discovery was a big set back at the time and I can remember a lecture title being changed from the 'The structure of lysozyme' to 'The structure of lysozyme two steps forward and one step back'. Thereafter the crystals were screened based on intensities of the (11,11,l) rows to distinguish them (e.g. 11,11,4 > 11,11,5 in one form and vice versa in another). Data were collected only for those that fulfilled the Type II criteria. (These reflections were easy to measure on the linear diffractometer because crystals were mounted to rotate about the diagonal axis). As I recall both Type I and Type II could be found in the same crystallisation batch . Although sometimes the external morphology allowed recognition this was not infallible. The structure was based on Type II crystals. Later a graduate student Helen Handoll examined Type I. The work, which was in the early days and before refinement programmes, seemed to suggest that the differences lay in the arrangement of water or chloride molecules (Lysozyme was crystallised from NaCl). But the work was never written up. Keith Wilson at one stage was following this up as lysozyme was being used to test data collection strategies but I do not know the outcome. An account of this is given in International Table Volume F (Rossmann and Arnold edited 2001) p760. Tony North was much involved in sorting this out and if you wanted more info he would be the person to contact. I hope this is helpful. Do let me know if you need more. Best wishes Louise
Ringer: systematic map sampling Lang et al. (2010) Protein Sci.19, 1420-31. Fraser, et al. (2009) Nature462, 669-73.
Ringer: systematic map sampling Ringer: systematic map sampling electron density (e-/Å3) χ1 angle (degrees)
Independent estimates of F000 Lang et al. (2014) PNAS USA111, 237-242. --
"error bar" for electron density error bars for electron density structure factor (e-/cell) electron density (e-/Å3) spot index fractional coordinate Lang et al. (2014) PNAS USA111, 237-242.
"error bar" for electron density error bars for electron density Refinement Against Perturbed Input Data electron density (e-/Å3) fractional coordinate Lang et al. (2014) PNAS USA111, 237-242.
1 “sigma” is nota good criterion normalized counts Electron Number Density (e-/Å3) Lang et al. (2014) PNAS USA111, 237-242.
using real crystal’s lattice Molecular Dynamics Simulation 1aho Scorpion toxin 0.96 Å resolution 64 residues Solvent: H20 + acetate Cerutti et al. (2010).J. Phys. Chem. B114, 12811-12824.
Answer: 40 How many conformers are there? Rcryst = 0.0506 Rfree= 0.0556 vs Fsim
Answer: 8 How many conformers are there? Rcryst = 0.0297 Rfree= 0.0293 vs Fsim
Answer: 2-14 How many conformers are there? Rcryst = 0.0441 Rfree = 0.0516 vs Fsim
Answer: 1-7 How many conformers are there? Rcryst = 0.1546 Rfree = 0.1749 vs Fobs 1aho: Rcryst = 0.1630 Rfree = n/d
How many conformers are there? All difference features are in the solvent! real data
How rough is the solvent? Electron number density (e-/Å3) x along line y=z=0 (Å)
Rcryst = 0.0309 Rfree = 0.0678 vs Fsim How “rough” is the solvent?
The Future of Structural Biology • will be noisy • Averaging destroys resolution • Multi-crystal data – isomorphism • structures of the future must be 4D • There is “life” below 1 σ