Download
1 / 12
130 likes | 361 Views
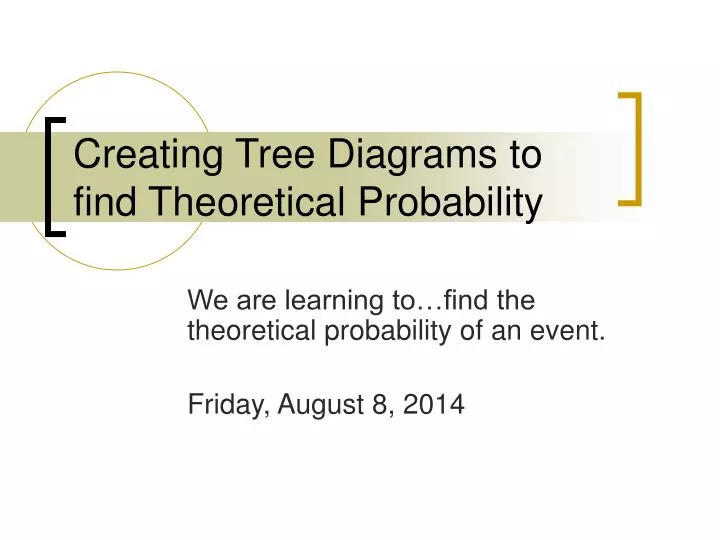
Creating Tree Diagrams to find Theoretical Probability . We are learning to…find the theoretical probability of an event. Friday, August 8, 2014. Vocabulary. Theoretical Probability - Probability that is based on likelihood of an event happening based on all the possible outcomes.

E N D
Creating Tree Diagrams to find Theoretical Probability We are learning to…find the theoretical probability of an event. Friday, August 8, 2014
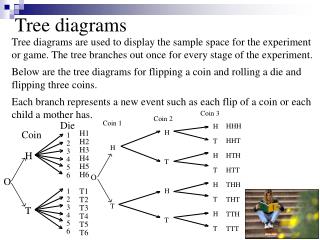
Vocabulary • Theoretical Probability - Probability that is based on likelihood of an event happening based on all the possible outcomes. • One way to determine theoretical probability is to build a TREE DIAGRAM • A Tree Diagram is a way to visually represent and organize all the possible outcomes of an experiment.
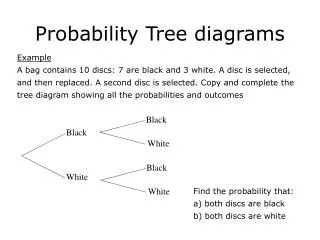
Warren owns an Ice Cream Shop and had the sign below made to let people know what they can order: Hot Fudge Sprinkles Caramel Ice Cream: Chocolate Vanilla Strawberry Mint Toppings: Sprinkles Peanuts Bananas Sauce: Hot Fudge Caramel Make a tree diagram to find all of the possible outcomes of ice cream, toppings and sauce at the ice cream store. Hot Fudge Chocolate Peanuts Caramel Hot Fudge Bananas Caramel Hot Fudge Sprinkles Caramel Hot Fudge Vanilla Peanuts Caramel Each end “branch” represents one possible outcome! How many possible outcomes are there? Hot Fudge Bananas Caramel Hot Fudge Sprinkles Caramel Hot Fudge Peanuts Strawberry Caramel Hot Fudge Bananas Caramel Hot Fudge Caramel Sprinkles Hot Fudge 24 Total Outcomes! Mint Peanuts Caramel Hot Fudge Bananas Caramel
Warren owns an Ice Cream Shop and had the sign below made to let people know what they can order: Hot Fudge Sprinkles Caramel Ice Cream: Chocolate Vanilla Strawberry Mint Toppings: Sprinkles Peanuts Bananas Sauce: Hot Fudge Caramel Make a tree diagram to find all of the possible outcomes of ice cream, toppings and sauce at the ice cream store. Hot Fudge Chocolate Peanuts Caramel Hot Fudge Bananas Caramel Hot Fudge Sprinkles Caramel Hot Fudge Vanilla What is the theoretical probability of a person walking into the store and ordering: strawberry ice cream, with bananas and hot fudge sauce? Peanuts Caramel Hot Fudge Bananas Caramel Hot Fudge Sprinkles Caramel Hot Fudge Peanuts Strawberry Caramel Hot Fudge Bananas Caramel Hot Fudge Event Occurs Caramel Sprinkles Hot Fudge Total Outcomes Mint Peanuts Caramel Hot Fudge Bananas Caramel
Warren owns an Ice Cream Shop and had the sign below made to let people know what they can order: Hot Fudge Sprinkles Caramel Ice Cream: Chocolate Vanilla Strawberry Mint Toppings: Sprinkles Peanuts Bananas Sauce: Hot Fudge Caramel Make a tree diagram to find all of the possible outcomes of ice cream, toppings and sauce at the ice cream store. Hot Fudge Chocolate Peanuts Caramel Hot Fudge Bananas Caramel Hot Fudge Sprinkles Caramel Hot Fudge What is the theoretical probability of a person walking into the store and order any type of ice cream with sprinkles and caramel sauce? Vanilla Peanuts Caramel Hot Fudge Bananas Caramel Hot Fudge Sprinkles Caramel Hot Fudge Peanuts Strawberry Caramel Hot Fudge Bananas Caramel Hot Fudge Event Occurs Caramel Sprinkles Hot Fudge Total Outcomes Mint Peanuts Caramel Hot Fudge Bananas Caramel
Warren owns an Ice Cream Shop and had the sign below made to let people know what they can order: Hot Fudge Sprinkles Caramel Ice Cream: Chocolate Vanilla Strawberry Mint Toppings: Sprinkles Peanuts Bananas Sauce: Hot Fudge Caramel Make a tree diagram to find all of the possible outcomes of ice cream, toppings and sauce at the ice cream store. Hot Fudge Chocolate Peanuts Caramel Hot Fudge Bananas Caramel Hot Fudge Sprinkles Caramel Hot Fudge Vanilla What is the theoretical probability of a person walking into the store and ordering vanilla ice cream with any kind of topping and sauce? Peanuts Caramel Hot Fudge Bananas Caramel Hot Fudge Sprinkles Caramel Hot Fudge Peanuts Strawberry Caramel Hot Fudge Bananas Caramel Hot Fudge Event Occurs Caramel Sprinkles Hot Fudge Total Outcomes Mint Peanuts Caramel Hot Fudge Bananas Caramel
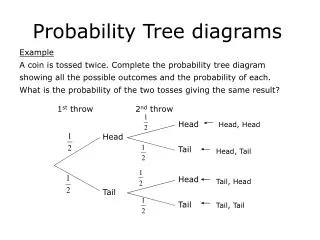
Heads Red Make a tree diagram to find all of the possible outcomes in this experiment. Red Blue Yellow Green Tails 1 Heads Blue Tina is performing an experiment where she is rolling a number cube, spinning a spinner with 4 equal sections with the colors red, blue, yellow and green and then flipping coin. Tails Heads Yellow Tails Heads Green Tails Heads Red Tails 2 Heads Blue Tails Heads Yellow Tails Heads Green Tails Heads Red Tails 3 Heads Blue Tails Heads Yellow Tails Each end “branch” represents one possible outcome! How many possible outcomes are there? Heads Green Tails Heads Red Tails Heads Blue Tails 4 Yellow Heads Tails Heads Green Tails Heads Red Tails Heads Blue Tails 5 Heads Yellow Tails Heads Green Tails Heads Red 48 Total Outcomes! Tails Heads Blue Tails Heads Yellow 6 Tails Green Heads Tails
Heads Red Make a tree diagram to find all of the possible outcomes in this experiment. Red Blue Yellow Green Tails 1 Heads Blue Tina is performing an experiment where she is rolling a number cube, spinning a spinner with 4 equal sections with the colors red, blue, yellow and green and then flipping coin. Tails Heads Yellow Tails Heads Green Tails Heads Red Tails 2 Heads Blue Tails Heads Yellow Tails Heads Green Tails Heads Red Tails 3 Heads Blue Tails Heads Yellow Tails Heads Green What is the theoretical probability of Tina rolling a 5, then spinning green and finally flipping tails? Tails Heads Red Tails Heads Blue Tails 4 Yellow Heads Tails Heads Green Tails Heads Red Tails Heads Blue Tails 5 Heads Yellow Tails Heads Event Occurs Green Tails Heads Red Tails Heads Blue Total Outcomes Tails Heads Yellow 6 Tails Green Heads Tails
Heads Red Make a tree diagram to find all of the possible outcomes in this experiment. Red Blue Yellow Green Tails 1 Heads Blue Tina is performing an experiment where she is rolling a number cube, spinning a spinner with 4 equal sections with the colors red, blue, yellow and green and then flipping coin. Tails Heads Yellow Tails Heads Green Tails Heads Red Tails 2 Heads Blue Tails Heads Yellow Tails Heads Green Tails Heads Red Tails 3 Heads Blue Tails Heads Yellow Tails Heads Green What is the theoretical probability of Tina flipping tails in her experiment? Tails Heads Red Tails Heads Blue Tails 4 Yellow Heads Tails Heads Green Tails Heads Red Tails Heads Blue Tails 5 Heads Yellow Tails Heads Event Occurs Green Tails Heads Red Tails Heads Blue Total Outcomes Tails Heads Yellow 6 Tails Green Heads Tails
Heads Red Make a tree diagram to find all of the possible outcomes in this experiment. Red Blue Yellow Green Tails 1 Heads Blue Tina is performing an experiment where she is rolling a number cube, spinning a spinner with 4 equal sections with the colors red, blue, yellow and green and then flipping coin. Tails Heads Yellow Tails Heads Green Tails Heads Red Tails 2 Heads Blue Tails Heads Yellow Tails Heads Green Tails Heads Red Tails 3 Heads Blue Tails Heads Yellow Tails Heads Green What is the theoretical probability of Tina rolling an even number, spinning blue and then flipping heads? Tails Heads Red Tails Heads Blue Tails 4 Yellow Heads Tails Heads Green Tails Heads Red Tails Heads Blue Tails 5 Heads Yellow Tails Heads Event Occurs Green Tails Heads Red Tails Heads Blue Total Outcomes Tails Heads Yellow 6 Tails Green Heads Tails
Heads Red Make a tree diagram to find all of the possible outcomes in this experiment. Red Blue Yellow Green Tails 1 Heads Blue Tina is performing an experiment where she is rolling a number cube, spinning a spinner with 4 equal sections with the colors red, blue, yellow and green and then flipping coin. Tails Heads Yellow Tails Heads Green Tails Heads Red Tails 2 Heads Blue Tails Heads Yellow Tails Heads Green Tails Heads Red Tails 3 Heads Blue Tails Heads Yellow Tails What is the theoretical probability that Tina will roll a number greater than 1, spin a green or red, and finally flip tails? Heads Green Tails Heads Red Tails Heads Blue Tails 4 Yellow Heads Tails Heads Green Tails Heads Red Tails Heads Blue Tails 5 Heads Yellow Tails Heads Event Occurs Green Tails Heads Red Tails Heads Blue Total Outcomes Tails Heads Yellow 6 Tails Green Heads Tails
Heads Red Make a tree diagram to find all of the possible outcomes in this experiment. Red Blue Yellow Green Tails 1 Heads Blue Tina is performing an experiment where she is rolling a number cube, spinning a spinner with 4 equal sections with the colors red, blue, yellow and green and then flipping coin. Tails Heads Yellow Tails Heads Green Tails Heads Red Tails 2 Heads Blue Tails Heads Yellow Tails Heads Green Tails Heads Red Tails 3 Heads Blue Tails Heads Yellow Tails Heads Green What is the theoretical probability that Tina will roll an odd number on the number cube in her experiment? Tails Heads Red Tails Heads Blue Tails 4 Yellow Heads Tails Heads Green Tails Heads Red Tails Heads Blue Tails 5 Heads Yellow Tails Heads Event Occurs Green Tails Heads Red Tails Heads Blue Total Outcomes Tails Heads Yellow 6 Tails Green Heads Tails