Download
1 / 24
240 likes | 396 Views
Utah’s Bicycle/Pedestrian Master Plan Design Guide: Giving Communities the Tools They Need for Active Citizens . Shaunna Burbidge, PhD Metro Analytics Brett McIff, PhD Utah Department of Health. Utah’s Health Status -- Obesity. State Rate: 11.7%. Obesity . State Rate: 19.5%. Obesity.

E N D
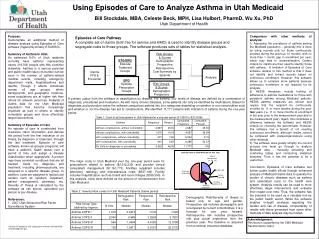
Utah’s Bicycle/Pedestrian Master Plan Design Guide:Giving Communities the Tools They Need for Active Citizens Shaunna Burbidge, PhD Metro Analytics Brett McIff, PhD Utah Department of Health
Utah’s Health Status -- Obesity State Rate: 11.7%
Obesity State Rate: 19.5%
Obesity State Rate: 22.1%
Obesity State Rate: 24.0%
How Do We Increase PA? • PAPPI Physical Activity Promotion through Predator Introduction
Benefits of Active Transportation • Health • Decreased risk of chronic diseases (e.g., heart disease, strokes, certain kinds of cancers, obesity related conditions) • Public Safety • Fewer accidents and slower speeds • Traffic Congestion • Fewer cars on the road • Increased visibility of cyclists • Economic Development • Accessibility and interaction with commercial environments
The annual health care cost of obesity in the U.S. has Doubled in less than a decade to $147 billion Finkelstein, E.A., Tongdon, Cohen, J.W., & Dietz, W. (2009) Annual medical spending attributable to obesity: payer-and-service-specific estimates. Health Affairs, 28:5, w822-w831.
Obesity in Utah • In Utah, 5.2% of our total medical costs can be attributed to obesity • This results in about $393 million spent on treatment related to obesity and related chronic conditions
The High Cost of Inactivity • Direct medical costs in the U.S. related to physical inactivity costs are about $76 billion • Beyond medical costs, the impact on mental health, productivity, and overall quality of life is much more critical
The Cost of Inactivity in Utah • Physical inactivity in Utah costs an estimated $256,673,411, or about $2,729 per person • Medical Care Costs: $27,805,033 • Workers Comp Costs: $498,136 • Lost Productivity Costs: $228,370,242 Physical Inactivity Cost Calculator (2006). East Carolina University, College of Health Education & Promotion. Available at http://www.ecu.edu/picostcalc/
Cost Savings If as little as 5% of inactive people became physically active, it could save an estimated $12,833,671 per year Physical Inactivity Cost Calculator (2006). East Carolina University, College of Health Education & Promotion. Available at http://www.ecu.edu/picostcalc/
Background • In 2010, the American Reinvestment and Recovery act (ARRA) made available funding to states and communities as Communities Putting Prevention to Work (CPPW) • While several communities applied, only the Utah Department of Health received funds • Dedicated to the development of the Utah Bicycle/ Pedestrian Master Plan Design Guide • Supporting trainings in late 2011/early 2012
Purpose • The Bicycle/Pedestrian Master Plan Design Guide is focused on: • Providing local municipalities with the background, support, and local examples of bicycle and pedestrian regulations, infrastructures, and systems • Not mandated, but supported and encouraged • Targets the planning department and elected officials • A “How-To” guide to creating a walkable/bikeable environment at the community level
Process • A Bicycle Pedestrian Task Force was created as part of a safety grant; this Task Force is the steering committee for the Guide • Composed of: • Utah Department of Health; Physical Activity, Nutrition, & Obesity Program • Utah Department of Transportation; Bicycle & Pedestrian Coordinator • Utah Department of Transportation; Safe Routes to School Program • Utah Department of Public Safety; Utah Highway Safety Office • Wasatch Front Regional Council • Utah Transit Authority • Salt Lake Valley Health Department • ….
The Guide • Step by Step “How To” Guide • Utah Specific • All Encompassing • Policy and Infrastructure • Beginner to Advanced • User Friendly • All departments and forms of government
How it Works • “Choose Your Own Adventure” • Chapters Organized by Level • Beginning • Intermediate • Advanced • Local Examples • Resource Guide
What You Can Do • Provide Comments • Speak-Up Locally • Raise Awareness • Follow-Up
Timeline • Finalizing Document • May 2011 • Final Approval from Task Force • June 2011 • Document Sent to Printer • June/July 2011 • Dissemination and Trainings • Fall 2011-Spring 2012
Burbidge@metroanalytics.com Bmciff@utah.gov