Download
1 / 28
280 likes | 376 Views
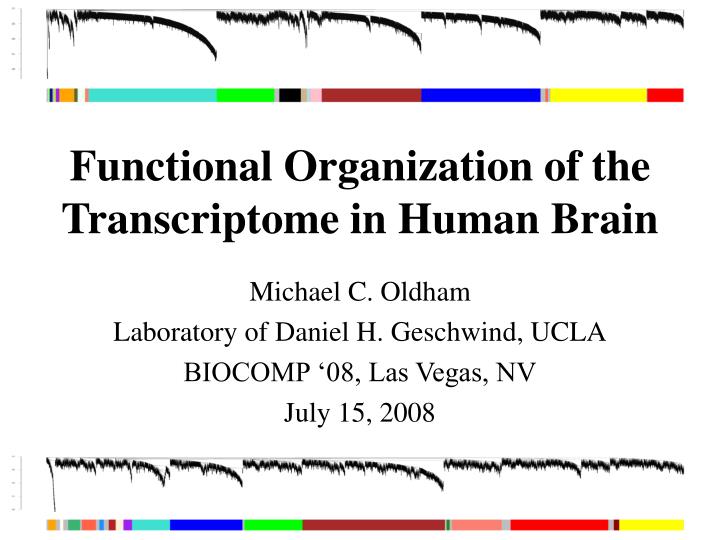
Functional Organization of the Transcriptome in Human Brain. Michael C. Oldham Laboratory of Daniel H. Geschwind, UCLA BIOCOMP ‘08, Las Vegas, NV July 15, 2008. Neurons. Astrocytes. Oligodendrocytes. Microglia. ~10 11. ~10 12.

E N D
Functional Organization of the Transcriptome in Human Brain Michael C. Oldham Laboratory of Daniel H. Geschwind, UCLA BIOCOMP ‘08, Las Vegas, NV July 15, 2008
Neurons Astrocytes Oligodendrocytes Microglia ~1011 ~1012
Microarray studies of the human brain face a number of challenges • Cellular heterogeneity • mRNA extracted from tissue homogenates • Sample quality • Post-mortem tissue • Sample size • Typically, <10 individuals per group • Focus on differential expression
The data Network 1 (U133 cortex): 67 samples, 67 individuals Network 2 (U95 cortex): 42 samples, 32 individuals Network 3 (U133 caudate nucleus): 27 samples, 27 individuals Network 4 (U133 cerebellum): 24 samples, 24 individuals * Raw data obtained in collaboration with Dr. Kazuya Iwamoto and Dr. Tadafumi Kato at RIKEN. ** Following outlier removal, there were 11 pairs of samples from the same individuals in Iwamoto et al. and Ryan et al. One unique sample per individual was retained.
A: CTX The networks M1A M2 M3 M4A M5A M6A M7A M8A M9A M10A M11A M12A M13A M14A M15A M16A M17A M18A M19A B: CTX_95 C: CN M5B M20 M21 M17B M22 M23 M24 M4B M9B M16B M10B M15B M25 M8B M19B M26 M18B D: CB M27 M4C M11C M28 M29 M30 M31 M19C M9C M1C M32 M13C M18C M33 M34 M35 M36 M8C M16C M37 M5C M15C M38 M1D M12D M19D M39 M18D M40 M41 M6D M10D M42 M14D M11D M4D M7D M43 M44 M45 M16D M46 M9D M15D M47
Quantifying module membership with kme • kme is the Pearson correlation between the expression level of a given probe set and a given eigengene, e.g.:
Conserved modules are enriched for markers of major cell classes 1 Cahoy, J.D. et al. J Neurosci28: 264-78 (2008) 3 Nielsen, J.A. et al. J Neurosci 26: 9881-9891 (2006) 5 Genes2Cognition Consortium 2 Lein, E.S. et al. Nature445: 168-76 (2007) 4 Bachoo, R.M. et al. PNAS101: 8384-8389 (2004) 6 Morciano, M. et al. J Neurochem 95: 1732-1745 (2005)
Thought experiment Amount Sample
The cortical transcriptome is organized into functional modules M1A M2 M3 M4A M5A M6A M7A M8A M9A M10A M11A M12A M13A M14A M15A M16A M17A M18A M19A
Modules are organized into a functional meta-network Neurons Oligodendrocytes Astrocytes Meningeal cells Neurogenesis Ribosomes Hypoxia Glutamatergic synapses Mitochondria Gender Microglia Purkinje neurons PVALB+ interneurons
Applications • Context-specific annotation for genes expressed in the human brain (“guilt-by-association”) • Rationale: genes with the strongest evidence of membership for the same module are likely to be driven by the same underlying factors
Applications • Context-specific annotation for genes expressed in the human brain (“guilt-by-association”) • In silico comparisons of cellular specificity of gene expression across brain regions • Rationale: genes with the most significant differences in membership for cell-type modules between brain regions imply differences in the cellular specificity and/or consistency of gene expression
Applications • Context-specific annotation for genes expressed in the human brain (“guilt-by-association”) • In silico comparisons of cellular specificity of gene expression across brain regions • Cellular phenotype discovery • Rationale: unsupervised analysis of gene coexpression patterns can identify novel distinctions among cell types within brain regions
Caudate nucleus M13C M15C 1 Cahoy, J.D. et al. J Neurosci28: 264-78 (2008) 2 Lein, E.S. et al. Nature445: 168-76 (2007) 3 Bachoo, R.M. et al. PNAS101: 8384-8389 (2004)
Conclusions • The human brain transcriptome is organized into modules of coexpressed genes • Many modules are reproducible across microarrays, individuals, and brain regions • Several highly conserved modules are enriched for markers of major cell classes • ‘Core’ transcriptional programs for neurons, oligodendrocytes, astrocytes, and microglia • Context-specific annotation for thousands of genes expressed in the human brain • Potential to leverage consistency of kme for comparisons with other conditions of interest (e.g. disease)
Acknowledgements Dan Geschwind Steve Horvath Gena Konopka Peter Langfelder Collaborators: Dr. Kazuya Iwamoto Dr. Tadafumi Kato The Geschwind lab


![2008 ITRS Emerging Research Materials [ERM] December 6, 2008](https://cdn2.slideserve.com/4220113/2008-itrs-emerging-research-materials-erm-december-6-2008-dt.jpg)