Download
1 / 3
180 likes | 953 Views
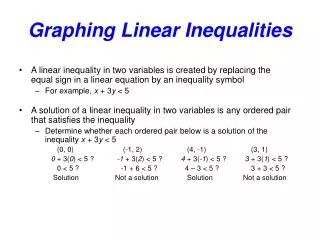
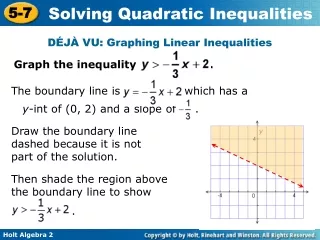
8. 6. 4. 2. -8. -6. -4. -2. 2. 4. 6. 8. -2. -4. -6. -8. Graphing Linear Inequalities. The graph of the linear inequality x + 3 y < 5 is shown at right The dashed line is the boundary line of the inequality

E N D
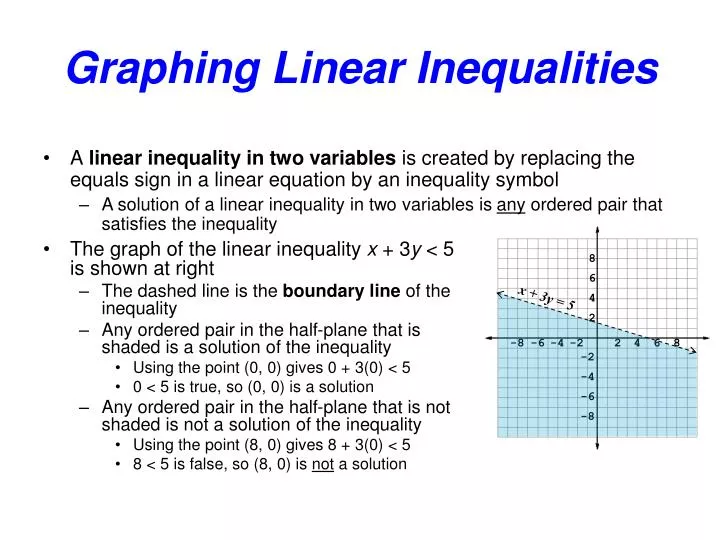
8 6 4 2 -8 -6 -4 -2 2 4 6 8 -2 -4 -6 -8 Graphing Linear Inequalities • The graph of the linear inequality x + 3y < 5 is shown at right • The dashed line is the boundary line of the inequality • Any ordered pair in the half-plane that is shaded is a solution of the inequality • Using the point (0, 0) gives 0 + 3(0) < 5 • 0 < 5 is true, so (0, 0) is a solution • Any ordered pair in the half-plane that is not shaded is not a solution of the inequality • Using the point (8, 0) gives 8 + 3(0) < 5 • 8 < 5 is false, so (8, 0) is not a solution • A linear inequality in two variables is created by replacing the equals sign in a linear equation by an inequality symbol • A solution of a linear inequality in two variables is any ordered pair that satisfies the inequality x + 3y = 5
8 6 4 2 -8 -6 -4 -2 2 4 6 8 -2 -4 -6 -8 Graphing Linear Inequalities • Example: Graph the linear inequality 2x + y > 2 • Find the associated equation by replacing the inequality symbol by an equals sign • Here the associated equation is 2x + y = 2 • The graph of the associated equation is the boundary line of the inequality • Draw a solid line if the inequality is ≤ or ≥ • Draw a dashed line if the inequality is < or > • Test a point on either side of the boundary line • Use (0, 0) if it is not on the boundary line • Shade (or cross-hatch) the half-plane that contains solutions to the inequality • If the test point works, shade that side • If the point does not work, shade the other side 2x + y = 2
8 6 4 2 -8 -6 -4 -2 2 4 6 8 -2 -4 -6 -8 Graphing Linear Inequalities • Graph the linear inequality x + 2y≤ -2 • The associated equation is x + 2y = -2 • The inequality is ≤ or ≥, so the boundary line is solid • The point (0, 0) is not on the boundary line, so use (0, 0) as the test point • Is the inequality 0 + 2(0) ≤ -2 true? • The test point (0, 0) does not work, so shade the half-plane that does not contain (0, 0) x + 2y = -2