Download
1 / 5
50 likes | 192 Views
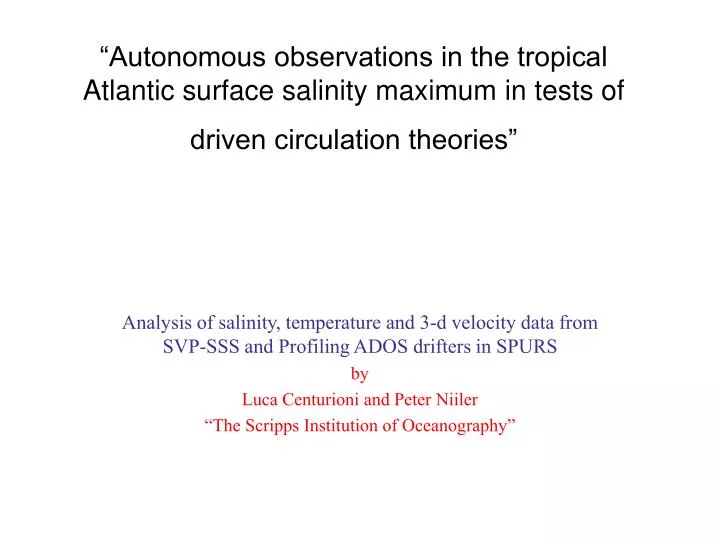
“Autonomous observations in the tropical Atlantic surface salinity maximum in tests of driven circulation theories”. Analysis of salinity, temperature and 3-d velocity data from SVP-SSS and Profiling ADOS drifters in SPURS by Luca Centurioni and Peter Niiler

E N D
“Autonomous observations in the tropical Atlantic surface salinity maximum in tests of driven circulation theories” Analysis of salinity, temperature and 3-d velocity data from SVP-SSS and Profiling ADOS drifters in SPURS by Luca Centurioni and Peter Niiler “The Scripps Institution of Oceanography”
The surface salinity overlain with the 15m depth velocity streamlines derived from the historical drifter data for the October-December period. The surface salinity distribution is derived from NOAA 2005 World Ocean Atlas and drifter data is from the period before June 2009. Both data are averaged at 1º spatial resolution. The inserts display our proposed deployment arrays of SVP-S and P-ADOS drifters.
The fall period absolute geostrophic hodographs referenced to absolute sealevel (Maximenko et al. 2009). The red “dot” is the 15m velocity derived from drifter data . The hydrographic data at standard depths from NOAA 2005 World Ocean Atlas, at black circles, are used for the derivations.
Scientific Objectives • Measure shallow overturning circulation in the salinity maximum of North Atlantic • Calculate the depth where the surface stress vanishes and the geostrophic circulation prevails using wind and momentum content observations that deviate from quasi-geostrophic balance • Relate horizontal and time scales of ‘surface’ salinity to eddy processes of horizontal filementing, or mixing, using drifter arrays with salinity sensors • Develop a new profiling drifter with salinity profile measurement that can also be used as remote air or ship deployed shallow water mooring • Relate field observations to high vertical resolution models of the upper ocean mixed layer where horizontal pressure gradient plays an important role • Make salinity observations from 55 drifters available in real time to SPURS investigators
The ADOS drifter with profiling “Wire-Walker” and SVP- SSS Drifter