Download
1 / 41
470 likes | 770 Views
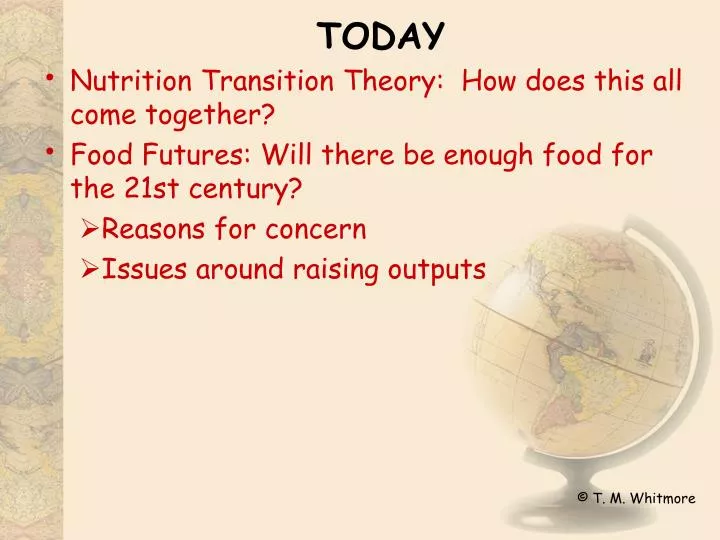
TODAY. Nutrition Transition Theory: How does this all come together? Food Futures: Will there be enough food for the 21st century? Reasons for concern Issues around raising outputs. Related historic processes of change. Interconnected “Transitions” Demographic Transition (DT)

E N D
TODAY • Nutrition Transition Theory: How does this all come together? • Food Futures: Will there be enough food for the 21st century? • Reasons for concern • Issues around raising outputs
Related historic processes of change • Interconnected “Transitions” • Demographic Transition (DT) • Stages of change in mortality and fertility => population growth over time • Regional differences-geography • Epidemiologic Transition (ET) • Shift in the patterns of causes of death over time • Regional differences-geography • Nutrition Transition • Shifts in dietary and physical activity-inactivity patterns • Regional differences-geography
The Nutrition Transition’s “Stage 1: “Collecting Food” • Hunter gatherers • High in carbohydrates and fiber and low in fat, especially saturated fat • Activity patterns are very high with little obesity • Stages 1-2 of DT • First phase in ET
The Nutrition Transition’s “Stage 2: “Famine” • Early agriculture and contemporary least developed areas generally • Diet becomes much less varied and subject to larger variations and periods of acute scarcity of food • Little change in activity levels • Stages 1-2 of DT • First-Second phases in ET
The Nutrition Transition’s “Stage 3: “Receding Famine” • Scientific agriculture, early industrialization, and contemporary developing areas • Consumption of fruits, vegetables, and animal protein increases, and starchy staples become less important in the diet • Activity patterns start to shift and inactivity and leisure becomes a part of the lives of more people • Stages 2-3 in DT • Second/Third Phases of ET
The Nutrition Transition’s “Stage 4: “Nutrition-related Non-communicable Disease (NR-NCD)” • Associated with “modern” industrial lifestyles • A diet high in total fat, cholesterol, sugar, and other refined carbohydrates and low in polyunsaturated fatty acids and fiber • Often accompanied by an increasingly sedentary life • Stage 4 in DT • Third Phase of ET
The Nutrition Transition’s “Stage 5: “Behavioral Change” • “Post-modern” industrial lifestyles • A new dietary pattern => changes in diet associated with the desire to prevent or delay degenerative diseases and prolong health • May be associated with increased “recreational” or health related exercise • Stage 4 in DT • Third Phase of ET
Food Futures reasons for concern I: Population Growth • Population growth to 8-10 billion by 2050 (50% more than today!) • All in less developed world (China = India each ~ 1.5 b)
Reasons for concern II: Dietary transitions • Moving up on the food chain • Traditional diets => ~2400 kcal; 10% animal • Improved diets => ~3000 kcal; 25% animal • Increased animal fraction => 4-5 times more animal feed (plant material) needs to be produced • Overall need ~ 2x current harvest to get improved diet by 2050 for everyone
Reasons for concern III:Changes in agriculture • Increases in pollution, erosion, and decreases in water availability potentially => • Slow growth or even decrease • Already slowing rates of growth of grain production per capita
Can we raise Output? 4 major areas of concern • Photosynthesis and crop productivity limits • Land, water, and nutrient (NPK) limits • Agroecosystems and biodiversity • Environmental change
1) Photosynthesis & crop productivity limits • There is an energetic limit: • Photosynthesis is < 5% efficient in converting sunlight to vegetative matter (even less if water or nutrients are short) • One way to address this is to improve the harvest index (= edible part/total biomass) • This is an area of possible progress • traditional wheat 20 - 30% • green revolution wheat 35 - 50%
1) Photosynthesis & crop productivity limits • There is an energetic limit: • Photosynthesis is < 5% efficient in converting sunlight to vegetative matter (even less if water or nutrients are short) • One way to address this is to improve the harvest index (= edible part/total biomass) • This is an area of possible progress • traditional wheat 20 - 30% • green revolution wheat 35 - 50%
2) Land & soil limits I • Agricultural land limits • ~ 1.5 giga (109) ha now cultivated and 1.6 giga ha (rainfed) potentially usable • Most area available for expansion in S.S. Africa & S. America savanna
2) Land limits II • Land needed per-capita • Traditional vegetarian diet => • 0.7-0.8 ha /capita • Chinese diet (2800 kcal; 15% animal) • ~ 1.1 ha/capita • Rich Western diet • ~ 4.0 ha/capita (much wasted and high meat fraction) • Better diet with some animal protein • ~ 1.5-3.0 ha/capita • if 10 b people in 2050 => • need 800 million ha to 3 gig ha (3000 million)
2) Land limits III • If 10 b people in 2050 => • Need 800 million ha to 3 gig ha (now use 1.5 gig ha) • Thus, no absolute limit due to amount of land if diet not excessive & all available land used – AND food can be moved from surplus areas to deficit areas • Regionally per-capita land availability is more problematic for 2050 • OK in Latin America • Adequate in Sub-Saharan Africa & Mid-East • Problematic in South & East Asia
2) Water limits I • Water: – in most systems water is the most important limit most years • Photosynthesis uses/needs lots of water also add evaporation and transpiration • 250 - 500 mm water needed per ha for low-yielding crops • 800 - 1000 mm water needed by high yielding crops • Current irrigation • ~ 250 million ha (only 8 m ha in 1800) • ~ 17% of all agriculture land • Creates 40% of all food
2) Water limits II • Current Water Use • Currently 5-7% of all available fresh water runoff used for agriculture • Even if water use only grew to match population => • by 2050 agriculture will need 1/3 of all available fresh water
2) Water limits III • Crop and animal water use efficiency • Small grains and pulses => • 0.25 m3 of water /million joules energy to humans (or about 1 liter per kcal) • Animals via grain and feed => • 25.4 m3 water/m joules energy to humans (100x more!) or ~ 100 liters per kcal
2) Water limits IV • Water use in diets • Vegetarian diet (2500 kcal/day) => • 0.9m – 1.2 million liters/capita/year • Rich world diets (more kcal and more animal foods) => • >> 2.0 m l/capita/year • Improved diets (more kcal and more animal foods than traditional vegetarian) => • ~ 2 million l/capita/year • So – 10 b people => • 20,000 m3 water or ~ 2/3 of ALL global runoff (assumes 2000 m3/capita/yr)
Demographic Transition Model Nutrition Patterns 1 & 2 Nutrition Patterns 3, 4, & 5
Nutrition Patterns 1 & 2 Nutrition Patterns 3, 4, & 5
Stages of Health, Nutritional, and Demographic Change Demographic Transition Epidemiologic Transition Nutrition Transition High prevalence infectious disease High fertility/mortality High prevalence undernutrition 2 3 Receding pestilence, poor environmental conditions Reduced mortality, changing age structure Receding famine Focus on family planning, infectious disease control Focus on famine alleviation/prevention Diet-related noncommmucable diseases predominate Reduced fertility, aging Chronic diseases predominate 4 Focus on healthy aging spatial redistribution Focus on medical intervention, policy initiatives, behavioral change 5 Source: Popkin, Barry M. ( 2002)Public Health Nutrition 5:93-103.
Stages of the Nutrition Transition Urbanization, economic growth, technological changes for work, leisure, & food processing, mass media growth Pattern 3 Receding Famine Pattern 4 Degenerative Disease Pattern 5 Behavioral Change • reduced fat, increased • fruit, veg,CHO,fiber • replace sedentarianism • with purposeful changes • in recreation, other activity • starchy, low variety, • low fat,high fiber • labor-intensive • work/leisure • increased fat, sugar, • processed foods • shift in technology of • work and leisure MCH deficiencies, weaning disease, stunting obesity emerges, bone density problems reduced body fatness, improved bone health accelerated life expectancy, shift to increased DR-NCD, increased disability period extended health aging, reduced DR-NCD Slow mortality decline Source: Popkin, Barry M. ( 2002)Public Health Nutrition 5:93-103.
Source: USDA/Center for Nutrition Policy and Promotion, March 3, 2006