Download
1 / 52
520 likes | 648 Views
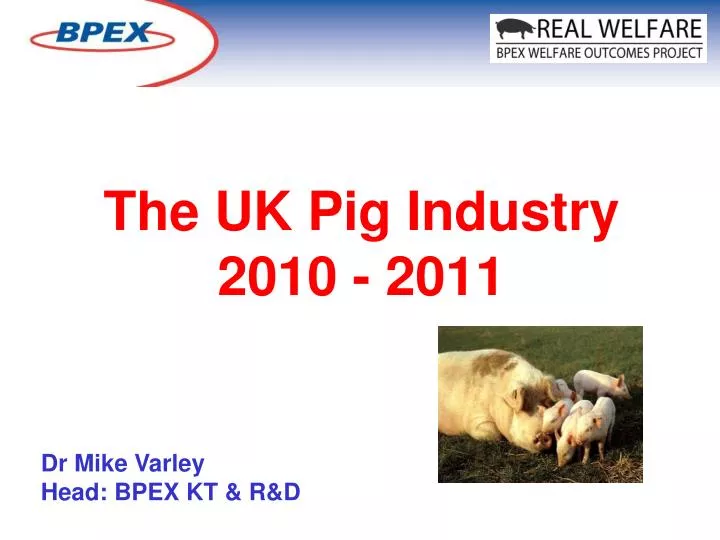
The UK Pig Industry 2010 - 2011. Dr Mike Varley Head: BPEX KT & R&D. MENU Consumer Demands & Operational Landscape Welfare Regulations & Outcomes – Concepts Where do we go next?. The Operating Landscape.

E N D
The UK Pig Industry 2010 - 2011 Dr Mike Varley Head: BPEX KT & R&D
MENU • Consumer Demands & Operational Landscape • Welfare Regulations & Outcomes – Concepts • Where do we go next?
The Operating Landscape • Consumers have been vociferous on welfare for about 25 years in the UK and Northern Europe • Consumer research has always indicated that at the point of purchase they ignore the ‘lip service’ on welfare • It is however a major driver for home produced pork purchase • Producers now realise that welfare is a major ‘differentiator’ for UK Pork against competition from Continental Europe (Denmark and Netherlands etc)
The Operating Landscape • UK Pork commands a premium differential price of around 30 p per kg deadweight compared to the rest of EU industries. • Our supermarket multiple retailers are well aware of this and sell hard on this fact for local UK produce • When imports from Europe really get cheap the retailers have a propensity to express more labelling mistakes !! (isotope analysis can stop this) • Welfare is therefore understood by all sectors of the pork supply chain
172 253 948 303 57 58 96 67 Flows in '000 t cwe 50-100 100-150 150-200 200-300 300-400 400-500 > 500 Pigmeat Tradeflows 64 281 65 74 158 66 325 120 85 264 482 107 75 54 84 144 Red arrow: decrease forecast in n+1 Black arrow: no significant change Blue arrow: increase forecast in n+1
Global Meat Consumption Trends 000 tonnes 000 tonnes 000 tonnes 000 tonnes
Pigmeat Supply Chain Assurance Scheme Processing – BQAP (BMPA) Abattoir – BQAP (BMPA) Transport - ABM Farm- ABP/Genesis Feed - UFAS
£/tonne delivered Feed wheat prices
Soya prices £/tonne Soyameal, HiPro, Ex-mill Liverpool
Nov Wheat Price Spot Option Difference 120 60000 66000 -6000 130 65000 71000 -6000 140 70000 76000 -6000 150 75000 81000 -6000 160 80000 81000 -1000 170 85000 81000 4000 180 90000 81000 9000 190 95000 81000 14000 200 100000 81000 19000 Managing the Risk – Protect don’t Predict • There are risk strategies that farmers can take, for example: • Don't wait until the end of your contract to negotiate the next contract • Buy a % of feed at different times, 25% of their feed every 3 months • Use options?
GB finished pig prices p/kg dw
Exchange rate movements UK pence Euro US dollar 100 95 90 85 80 75 ` 70 65 60 55 50 45 Jan-06 Jul-06 Jan-07 Jul-07 Jan-08 Jul-08 Jan-09 Jul-09 Jan-10
£/pig +20 Net producer margins in the UK +17 +16 +15 +15 +13 +11 +10 +10 +10 +7 +6 +5 +5 +3 +2 +2 +0 -1 -5 -8 -10 -11 -15 2007 2008 2009 Feb-09 Mar-09 Apr-09 May-09 Jun-09 Jul-09 Aug-09 Sep-09 Oct-09 Nov-09 Dec-09 Jan-10 Feb-10 (Est)
Carcase Balance (UK Requirement) 3 Million Pigs 23 Million Pigs 19 Million Pigs UK Production approx 9 Million Pigs
How are other proteins performing? Pork consumption has declined slightly since May 2010, but is still in growth (+0.6%). Beef and Lamb have experienced a decline over the last 3 years. Total Protein Cuts +5.2% vs. 07 +0.6% vs. 09 Total Beef Cuts -6.9% vs. 07 -0.5% vs. 09 Total Lamb Cuts -1.2% vs. 07 -3.1% vs. 09 Total Chicken Cuts +6.5% vs. 07 +0.6% vs. 09 Millions of Occasions +0.6% vs. ‘09 +2.9% vs. ‘07 WorldpanelUsage
http://www.guardian.co.uk/lifeandstyle/2010/sep/04/organic-pork-recipes-fearnley-whittingstallhttp://www.guardian.co.uk/lifeandstyle/2010/sep/04/organic-pork-recipes-fearnley-whittingstall http://www.jamieoliver.com/bacon/pigwelfare
FOCUS ON HAM AND BACON SANDWICHES The Rise of the Bacon Sarnie
The BPEX Road to Recovery 2006 - 09 The British Pig Industry
Where are all the pigs? • 10,000 pig premises • 1600 assured farms account for 92% production • 35 companies account for 50% of breeding herd • 10 companies account for c. 35% of breeding sows
Breeding herd trends 000 head
Estimated sow productivity trends kg pigmeat per sow per year
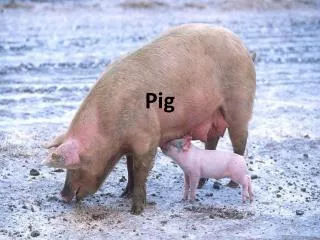
PIGS ARE - Omnivores – they will eat anything !! Non-ruminants – they cannot digest fibre Very fast growing – double birth weight every 7 days Reach 100 kg at 140 days Very good feed converters – 2.1 FCR Nowadays – very lean indeed P2 9 mm Very prolific – 26-33 pigs/sow/year – gives a low maintenance for the breeding female
What Welfare is Important? • Outdoor production – versus indoor intensive – 40% of UK industry is outdoor bred – liked by consumers • This is a visible indicator to consumers (who then complain about keeping pigs outdoors in winter !! • UK banned individual sow stalls in 2000 (rest of EU by 2012) UK all straw based group housed systems • Regulations on stocking densities • Tail docking banned – but low compliance on this • Teeth clipping banned – low compliance • Weaning not less than 28 days – high compliance • Compulsory use of manipulable materials for all pigs
European Welfare EU Legislation QA Rules UK Legislation Premium Rules Supermarket Rules
BMI - Corowa 27,000 sows – one site – 5 modules Large Scale Pig Production Australia
Outdoor Pig Production – Yorkshire England Barley, Wheat, Peas, Beans, Soyabean, Fish Meal, Co-Products
Defining welfare My optimal welfare is achieved when I have a Lear Jet and 2 Ferraris plus 6 wives and 4 houses to keep them all in. Varley 2010 • “An individual’s state as regards its attempts to cope with its environment” (Broom, 1986) • “ Prevention of the experience of an unpleasant mental state” (Duncan & Petherick, 1991) • “ The capacity of an animal to sustain physical fitness and avoid mental suffering” (Webster, 1998)
THE FIVE FREEDOMS • Freedom from hunger and thirst • Freedom from thermal and physical discomfort • Freedom from pain, injury and disease • Freedom from fear and stress • Freedom to express normal behaviour
Requirements of practicalassessment methods • Simple • Quick • Objective • Credible
Welfare Evaluation • Assessment of animal behaviour • Stereotypies, Open Field testing etc • Assessment of immune status • IgG concentrations, ACTH challenge etc • Assessment of animal performance • KPIs growth rate, FCR, morbidity and mortality Not practicable under individual farm conditions over time
ICEBERG INDICATORS What you can measure simply and quickly What it reliably represents in terms of overall pig welfare (but takes too much time and money to measure)
An Iceberg Indicator Score 0 Score 2 Score 1 Skin Lesions: Do a few scratches matter?
Lesion Scoring Systematic subjective scoring of tail and body lesions
Welfare Outcomes – Stage 1 • On-farm evaluation (6 farms) of welfare indicators (lesions, dirtiness, lameness, oral behaviour, bursae etc) • Small scale study on limited numbers • Did yield a ‘boil down’ to 5 principal indicators of pig welfare that could be used within existing QA processes or veterinary visits • Bristol University programme
Welfare Outcome – Stage 2 • Aim to identify and measure 180 farms – outdoor indoor breeding and finishing units • Full training of local veterinarians • To identify any measurement or analytical / statistical problems • The next stage is then full national roll out
Welfare Outcome – Stage 2 • Tail Lesion Score • Body Lesion Score • Lameness Score • Manipulable Material Use • Proportion of Hospitalised Pigs
Conclusions • Stage 1 has produced some ‘easy measures’ that are practical and yet are meaningful in the big iceberg picture • The Stage 2 scheme can be quickly followed by the national roll-out • The programme is supported by the QA programmes – QA inspectors will ultimately carry out the inspections as part of their normal quarterly visits (Supermarkets are watching carefully)