Download
1 / 24
240 likes | 470 Views
Introduction to hypothesis testing. Chapter 8. The goal of research. Test hypotheses Hypothesis = prediction Involves difference between distinct groups Children who watch violent television are more violent than children who do not watch violent television

E N D
Introduction to hypothesis testing Chapter 8
The goal of research • Test hypotheses • Hypothesis = prediction • Involves difference between distinct groups • Children who watch violent television are more violent than children who do not watch violent television • Involves association between quantitative variables • The more spinach people eat, the longer they live
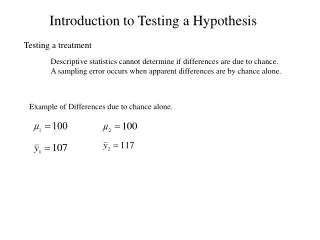
Alternative possibilities • The hypothesis may be correct • The hypothesis may be incorrect • The null hypothesis is correct – nothing is going on; groups are not different, variables are not related
The logic of hypothesis testing • Much like the logic of the judicial system • Start out thinking that nothing is going on – the null hypothesis is presumed correct, the defendant is presumed innocent • Only reject this idea if there is a preponderance of evidence against it
Another example • Flipping a coin with a friend – is it a fair coin? • Null hypothesis = nothing is going on it is a fair coin • Alternative hypothesis = something is going on it’s not a fair coin • One or the other of these has to be true
Steps of logic • Initially assume the null hypothesis is true • Assume it is a fair coin • Collect some data • How likely is it to see this pattern, if the coin was fair? • If it’s unlikely enough, you’ll need to reject the assumption that the coin is fair
How unlikely is unlikely enough? • Defined by alpha level, or level of significance • = how unlikely it has to be to see what you’re seeing, if the null hypothesis was true in order to reject the null hypothesis • Danger with making this too low? • Danger with making this too high?
Alpha • Conventionally set at .05 • if outcome you see would happen less than 5% of the time if the null hypothesis were true, reject the null hypothesis
Likelihood of outcomes? • Can get from unit normal distribution • Tells about getting samples with means that are different distances from the mean of the population • if the null hypothesis were true, the mean of the population would be X • Can then figure out how likely it would be to get a sample with a mean of Y if the mean of the population was X
A soap example • Are the children? • Null hypothesis? • If the null were true, what should the height of the kids (once they are fully grown) be? (assume height just comes from your side of the family) • compare the mean height of your children (sample) to what the mean height of the population they are from would be, if the null were true
Dividing the unit normal curve • Unit normal curve here captures what the world would look like if the null hypothesis were true • Would have variability from sample to sample, but would be unlikely to get strange weird samples • How far from the mean of the population would the mean of the sample have to be so you’d only get that weird of a sample 5% of the time? • Remember, sample could be weird by being tall or weird by being short
Names of the regions • Region of acceptance = region where the non-weird samples are • If the null hypothesis were true, it wouldn’t be surprising to get samples like this • if you get samples like this, there’s no reason to think that the null hypothesis is not true
Names of regions • Critical region or region of rejection = area with the weird samples • If the null hypothesis was true, it would be surprising and unusual to get samples like this • It’d be so surprising and unusual that you’d conclude the null hypothesis is not true • you’d reject the null hypothesis
Practicing this with numbers • Mean height of population? • Standard deviation of population? • Number of children? • Standard error of the mean? • Critical region? • Mean height of children? • Conclusion?
The bottom line of hypothesis testing • Assume the null hypothesis is true • Determine the critical region of the unit normal curve • Collect data • If the data fall in the critical region, reject the null hypothesis • If this happens, the z-score with your data is more extreme than the critical z-score • i.e., your sample is weirder than the critical weirdness level • Result is called statistically significant
Another way to think of it all • Could compare weirdness of your sample to critical weirdness • Could also compare likelihood of getting your sample to critical likelihood • Can determine likelihood of getting a sample as odd as yours, just by chance if the null is true • Referred to as p value • if p < alpha, result is statistically significant • Alpha conventionally = .05 • if p < .05, result is statistically significant • Stranger sample = less likely to get by chance if null is true • more extreme z-score = smaller p
Weird in one direction, or weird in any way? • Weird in any way = hypothesis that something is going on • critical region covers both sides of the distribution • non-directional, or two-tailed, test • Weird in one direction = hypothesis that something in a particular direction is going on • critical region covers just one side of the distribution • directional, or one-tailed, test
Being wrong and being right • You never know if your conclusion is correct • You only have access to data from the sample, not the entire population • Your conclusion is right if: • The null hypothesis is true, and you think it’s true • The null hypothesis is not true, and you think it’s not true • Your conclusion is wrong if: • The null hypothesis is true, and you think it’s false (type 1 error) • The null hypothesis is false, and you think it’s true (type 2 error)
Thinking about errors • Alpha = Acceptable likelihood of making a type 1 error • Type 2 error may arise if something is going on, but: • Not much difference between groups • Small sample size ( large standard error of the mean z-scores will be small) • Large standard deviation in population ( large standard error of the mean z-scores will be small)
How much difference between groups? • Z-score of sample captures how much the sample stands out from what the mean of the population would be if the null hypothesis was true • Tells about difference between means, taking into account variability from sample to sample • can get a large z-score (and a small p) if the sample size is large enough
How to measure how much difference between groups? • Need a measure that does not take sample size into account • effect size = how much of something is going on? • Common measure = Cohen’s d • Difference between mean of what population would be if the null was true and mean of the sample, divided by the standard deviation • not affected by sample size • gives better measure of how much of something is going on
What if effect size is very small? • Need to be able to say that a small difference is unusual enough to find, if the null hypothesis is true, to be able to reject the null • need big sample • need small standard deviation • helps to have directional hypothesis
Power • Probability of being able to detect a particular effect size • If the effect size were X and the research hypothesis were true, power = proportion of samples that would let you reject the null hypothesis
Be sure to • Review new vocabulary • Review logic • Review steps of hypothesis testing • This is the most important chapter in this entire class • This logic underlies all of hypothesis testing