Download
1 / 18
180 likes | 255 Views
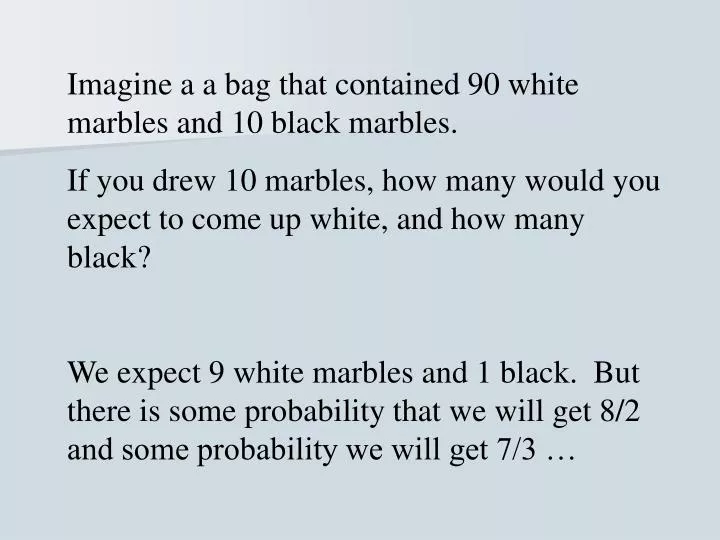
Imagine a a bag that contained 90 white marbles and 10 black marbles. If you drew 10 marbles, how many would you expect to come up white, and how many black? We expect 9 white marbles and 1 black. But there is some probability that we will get 8/2 and some probability we will get 7/3 ….

E N D
Imagine a a bag that contained 90 white marbles and 10 black marbles. If you drew 10 marbles, how many would you expect to come up white, and how many black? We expect 9 white marbles and 1 black. But there is some probability that we will get 8/2 and some probability we will get 7/3 …
What do we do? • We can compare what we would expect by chance to what we actually observed. • We can make a probabilistic statement about the chances of observing what we did based on our expectations. • Finally, we test the hypothesis that there is no real difference between what we observed and what we expected.
Basic Assumption of the Null Hypothesis • There is no difference in the population—the difference you observe is just the chance variation of your sample. • Expected score-Observed score = zero + SE • We are comparing observed values (“frequency actually observed in our sample, written “f0”) to some set of expected by chance frequencies (written “fe”).
Chi Square (χ2) • The test statistic for testing hypothesis comparing 2 or more nominal or ordinal categories • The Chi Square Statistic compares nominal values in a cross-tabulation table—making what are called row by column comparisons or “r x c” tables.
DON’T WRITE ANY FORMULAS ON THE FOLLOWING SLIDES. JUST FOLLOW MY DISCUSSION.
The formula for c2 is: OR, sometimes written Where f0 is the observed frequency of each category in each cell of a table and fe is the expected value of each category in each cell.
NOTE that c2 works with frequencies in each cell. We will compare what we observe in each cell to what we would expect in that cell by chance alone.
The Chi Square statistic tests : • Whether the difference between what you observe and what chance would predict is due to sampling error. • The greater the deviation of what we observe to what we would expect by chance, the greater the probability that the difference is NOT due to chance. Doesn’t this sound like “Principle #1” from the 300Reader for significance tests? What is “Principle #2”?
DIFFERENCE BETWEEN EXPENSIVE AND CHEAP SODA • Consumer Reports routinely finds that many people who claim they can taste the difference between brands actually can’t—they are influenced by the label. • How would you test the ideal that people cannot really tell the difference, that they are really responding to the price label information, that people in general lack the ability to taste a difference. How do we disentangle the label effect from taste?
Study Design: Sample 150 Dr. Pepper drinkers. Place before them 3 bottles filled with Wal-Mart’s “Dr. Thunder” drink. However, one bottle is labeled with “Dr. Pepper”, another is labeled as “Wal-Mart’s Dr. Thunder”, and the third is labeled “Caramel and spices with carbonation”. All 150 Subjects taste each bottle and state preference. What is the null? ==> No more likely to choose one than the other. In other words, 1/3 of subjects (50 people) choose each option
Step 1. Hypothesis: Null = the proportions preferring each bottle should be equal IF indeed the drinks are equal, that is, IF One’s preference is NOT influenced by label. Here, chance would predict 50 people in each group if label did not matter. The ratios of O to E values should be the same across all 3 comparisons if label does not matter. The O : E ratios in each column should be the same. Our alternative hypothesis is that preferences will follow the status of Label # 1 > #2 > #3.
Step 2. The Distribution. Since we are interested in analyzing a crosstab, the c2 distribution is appropriate -- we are doing a row by column [r * c] analysis. Step 3. Level of Significance: Set the significance level at .05 The chi square distribution changes shape by degrees of freedom (i.e., How “free” is each cell entry?). If the sum of ten numbers is known to be 400 and numbers 1-9 sum to 360, then the tenth number is NOT “free to vary” (i.e., it must be 40). In the “ten numbers” situation there are 9 degrees of freedom (i.e., all ten numbers are NOT “free to vary). You need this information to use a chi square table.
FORMULA for df c2 degrees of freedom = (# row -1) * (#columns - 1) We have a 3 by 2 table, so df = (row - 1) = (2 - 1) 1 and (column -1) = (3 - 1) 2. So df = 2 TIMES 1 = 2. Step 4: Compute χ2 from your data:
Dr. Pepper Dr. Thunder Carb. Caramel OBSERVED 77 41 32 EXPECTED 50 50 50 (O - E) 27 -9 -18 (O - E)2 729 81 324 (O - E)2/E 729/50 = 14.58 81/50 = 1.62 324/50 =6.48 14.58 + 1.62 + 6.48 = c2 = S = 22.68
Step 5: Decision: Look up the “critical” value of the Chi Square value in a chi-square table. In our situation, the critical value (i.e., the .05 level of significance) is 5.991. Since the chi-square value we attained is 22.68 it is beyond the critical value of 5.991; Step 6: State Conclusion. Reject the null hypothesis because there is less than a 5% chance of committing a type 1 error. We will never know if we have committed a type 1 error. Could we have committed a type 2 error?