Download
1 / 20
200 likes | 319 Views
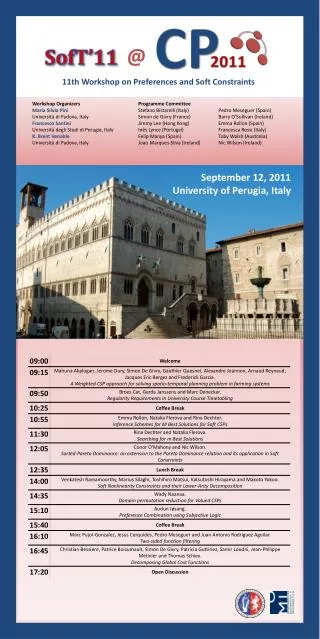
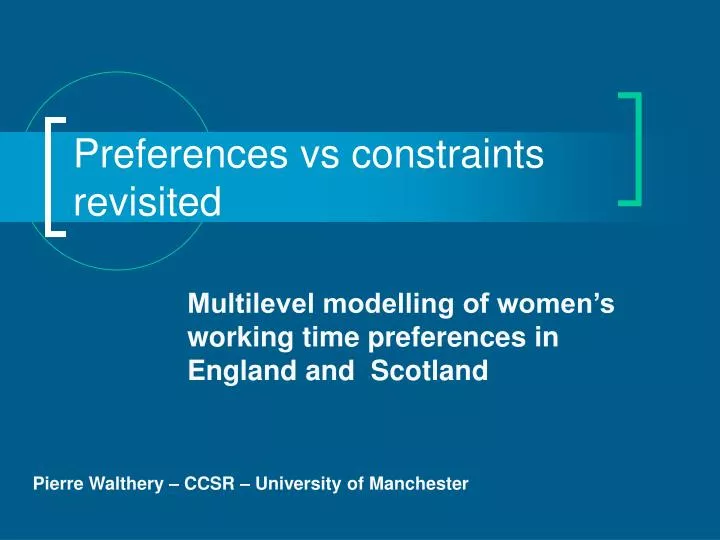
Preferences vs constraints revisited. Multilevel modelling of women’s working time preferences in England and Scotland. Pierre Walthery – CCSR – University of Manchester. Structure of the presentation.

E N D
Preferences vs constraints revisited Multilevel modelling of women’s working time preferences in England and Scotland Pierre Walthery – CCSR – University of Manchester
Structure of the presentation • Preferences, constraints, orientations to work: explaining women’s labour force participation • Reversing the perspective: modelling preferences • Data & methods • Main results • Conclusions/future work
Women and the LM -- What • A traditional pattern among British women: in, out, and in again -- maybe --later (Martin & Roberts 1984 Gustaffson et al ?). • The cross-sectional view --mind the gaps: • Activity • Employment • Earnings • Gender segregation • For a long time, a large number of empirical researchers seem to have stood ‘somewhere in the middle’ in a tacit agreement.
Women and the LM • Harmony was broken by Hakim’s presentation of her PT. • She drew both on RCT and Revealed Preferences approaches. • Contends that: • Women can be divided into three broad ‘work orientations’ based groups, the most important of which is made of adaptive women. Others are either work or family oriented. • It is these ‘lifestyle’ preferences, rather than social structure, or constraints that can best predict and explain women’s subsequent labour market participation • However, this is only true in countries where a ‘real choice’ is possible: ie the US & the UK (as opposed to Sweden). • Preferences, not attitudes are causal.
Women and the labour market • Gathered a large amount of reactions, most of which were quite critical. • However: • Had the merit to stimulate the discussion and subsequent research avenues; • Put the issue of women’s agency back at the centre of the academic debate (Walsh 2005). • Alternative views: • Classless women (Ginn et al 1996; McRae 2003) • Polarization between women (Joshi et al; Crompton et al 1998) • Preferences only loosely match behaviour, circularity (Crompton et al 2005). • Preferences vary across time and following events in the lifecourse. Identities are adaptable (Himmelweit & Sigala 2004) • Mostly qualitative research has dealt with the contingency of preferences • Preferences and attitudes are for a large part dependent on a woman’s circumstances. • Their relation to actual labour market is probably complex, time and path-dependent.
Modelling preferences – in theory • Semi freedom: social practice (Bourdieu) determined by a habitus within boundaries set by social structures. • They could be seen as different interdependent layers of constraints and opportunities: • The amount of economic, social, cultural capital women possess • Gender structures -- ie gender roles / gender regimes (Connell) Institutions: labour market, childcare markets and facilities • Cultural dimension (Duncan/Pffau-Effinger) • Within these constraints, preferences are forming and evolving
Modelling preferences – in practice • Creating a statistical model accounting for variations in preferences: 1. Characteristics that are measurable at the individual level: Are individual/household circumstances, significantly associated to preferences? 2. Geography: Is there additional local-authority (LAD) based variation in preferences? Does this match any measured characteristics of the LAD (ie unemployment level, availability of childcare)? 3. Time. Not there yet. • Working-time preferences as an indicator of willingness to get involved more/less in the labour market.
Data • Special License Annual Population Survey for England and Scotland. • Two quarters of the Labour Force Survey + booster samples • Large scale stratified random sample (n>350,000): good geographical coverage, more reliable estimates • ‘Special licence APS provides information about LAD. • Mostly ‘hard’ data, very few questions about attitudes and preferences, orientations • Do not allow easily allow to mix individual and household level variables • Merged with: • LAD- level reliable estimates from the 2001 Sample of Anonymised Records from the Census (Sars) • Administrative records from Ofsted (2006) & the Scottish Executive (2006) about childcare places • Allow to create LAD-level indicators: ratio of childcare places to children under 10, proportion of women working in large companies • Population of reference: 36,510employed women aged 15 to 59 who expressed working time preferences, in England and Scotland.
Model -- 1 • 3 logistic models of the probability for part-time and full-time and all working women to be willing to work less hours: binary outcome. • Actual part-time and full time work • Independent variables are: • Age (age squared) • Log of hourly pay • Highest educational achievement • NS-SEC Social class • Marital status • Age of the youngest child (banded ) • Company size in the main job • Hours actually worked • LAD level: • ratio of childcare places to children under 1 • proportion of women working in large companies • proportion of households from NS-SEC social class 3,4,5 • Do not/cannot take childcare prices into consideration • Do not account for informal childcare
Model -- 2 • Fixed and random effect 2-levels logistic regression of the same model: • Level 1: Individual women • Level 2: Local authorities • Level 2 variation: • Is there significant LAD level variation at all? • How is it affected by the independent variables? • Interaction with variables accounting for characteristics of local authorities? • Is there any significant LAD-level variation in the effect of the independent variables on WT (ie random effects)?
Logistic regression – a survival guide • LR models the probability of a binary outcome y to take place given a number of covariates • These predictors – the independent variables ‘impact’ on the ‘logit’ of the probability of the outcome – ie the log odds. • They can be measured either on the logit scale or in term of odds ratios. • In addition to the variation in the likelihood of y ‘explained’ by the predictors, we are also testing whether there is a significant residual variation between local authorities.
Characteristics of the sample Mean age, hourly pay and hours actually worked of employedwomen aged 16-59, England & Scotland, 2005- 2006 % Source: Annual Population Survey April 2005-March 2006
Characteristics of the sample Working time preferences of employedwomen aged 16-59, England & Scotland, 2005, % Source: Annual Population Survey April 2005-March 2006
Main findings : individual level • Preferences are contingent to a number of factors: • Hourly wage, age, number of hours actually worked, being single very significantly matter in the likelihood of being willing to work less hours for both part-time and full-time working women • Contrasted effect of • company size (middle and large • education, • social class, • age of youngest child:
Main findings – LAD levels • Significant residual variation of working-time preferences between LAD. • Only marginally reduced by introducing dependent variables in the model. • Little match with level 2 variables • Being single for part-timers has an effect significantly different across areas ie ‘random’ (.04)
Conclusion • Consistent pattern of association between individual, household and institutional circumstances • although not necessarily where and how initially expected. • To do list : • In depth analysis of geographies • Looking at preferences for more hours • Adding the time dimension