Download

1 / 27
280 likes | 456 Views
Community Coordinated Modeling Center. Campaign and Climatology Assessments of Ionosphere/Thermosphere Models. BA Emery, JS Shim , D Anderson, D Bilitza , J Chau , AJ Coster , JT Emmert , M Fedrizzi , LP Goncharenko , L Lomidze , AJ Mannucci , S McDonald, X Pi,

E N D
Community Coordinated Modeling Center Campaign and Climatology Assessments of Ionosphere/Thermosphere Models BA Emery, JS Shim, D Anderson, D Bilitza, J Chau, AJ Coster, JT Emmert, M Fedrizzi, LP Goncharenko, L Lomidze, AJ Mannucci, S McDonald, X Pi, L Scherliess, P Stephens, E Sutton, Q Wu SWW, 26 April 2012, Boulder, CO
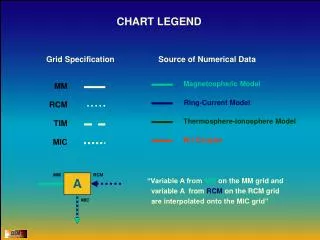
CCMC Electrodynamic-Ionosphere-Thermosphere Challenge .The CEDAR Electrodynamics-Thermosphere Ionosphere (ETI) Climatology Challenge selected several GEM storms and the year of ISR observations (March 2007 – March 2008) for climatology at the first CEDAR ETI Challenge Workshop in the summer of 2009. . We examine December 13-15, 2006 for quiet day to storm (GEM period 12 UT Dec 14 to 24 UT Dec 15) and solar minimum December solstice (07355) for +/-30 days. . Data sets: MIT, JPL, and IGS GPS TEC, USU COSMIC NmF2 and hmF2, NRL satellite drag daily global neutral density at 400 km, CHAMP neutral density at 400 km, Jicamarca ion drifts (mags, JULIA, ISR) . Models: IRI, SAMI3_HWM93, USU_IFM, CTIPe, TIEGCM (HeelisKp), USU_GAIM by CCMC, and other TIEGCM and SAMI3 runs.
COSMIC NmF2 and HmF2 For 15 min averages of 5x5 glat/glon bins on Dec 13, 2006, a 24-h lon period has 96*36=3356 total bins. COSMIC fills 1-2% (~60) of the bins, but MIT GPS TEC fills 34-79% (~1140-2650) of the bins.
Choose 8 Longitude Slices from GPS TEC 5 deg lat and 5 deg lon bins for 20 min in December solstice 07355. Longitudes chosen: 25E, 90E, 140E , 175E, 200E (160W), 250E (110W), 285E (75W), 345E (15W).
Hourly coverage of the 8 longitude slices for 21 December 2007 from MIT GPS TEC analysis. Minimum number of bins 446 (52%) for 345E, maximum 727 (84%) for 140E for 24h*36lat = 864 bins. Can see daily low latitude maxima.
TEC Observation vs Modeled Values (140°E lon) Through Japan and Australia along west side of Pacific Ocean 1_IRI 1_SAMI3_HWM93 1_USU-IFM 1_CTIPE 1_TIEGCM 2_TIE-GCM 3_TIE-GCM 1_USU-GAIM GPS TEC (MIT) GPS TEC (JPL)
TEC from GPS: RMSE • red square : score for daytime (0600-1800 LT) • blue circle : score for nighttime (1800-0600 LT) • model ranking is arranged by score for 24 hrs (denoted by cross). • the best performing model is located in the extreme left. • during the day > during the night • data assimilation model, 1_USU-GAIM ranks at the top except for the southern high latitudes. • no big difference in RMSE between models for the northern high latitudes • TIE-GCMs ≈ 1_CTIPe • 1_CTIPe performs better than TIE-GCMs during the night and winter NH pole • TIE-GCMs perform better than 1_CTIPe during the day and summer SH pole
Mean Absolute Percentage Error IRI best for hmF2 and most NmF2 but not for TEC except winter NH TEC NmF2 hmF2
Shim Summary for Dec 2006 • model performance depends on • - latitude • - season • - local time • - metrics selection • - data set • none of models ranks at the top for all used metrics or data sets • - IRI best for NmF2, near best for hmF2, and in middle for TEC • establishes a baseline for new models and future versions
Comparison of MIT and IGS TEC IGS higher anomaly peaks, lower TEC winter NH pole and higher TEC summer SH pole.
Daily TEC (global and glon-24h) See peaks in the area-weighted global and daily glon TEC in the GPS data and the models.
Solar Wind and Global TEC and Neutral Density at 400 km The conditions from 07325-08020 were dominated by 5 periods of High Speed Streams (HSS) in the solar wind velocity (Vsw) and low solar wind. Kp values were usually >2 for the HSS and <1 for the low Vsw. The HSS prompted high global TEC and neutral densities at 400 km in satellite drag data (red) from Emmert [2009, JGR], MSIS (cyan) and TIEGCM Weimer05 with TIMED lower boundaries.
Separating HSS and Slow Speed Wind Choosing Kp>=2 and Vsw>=500km/s and Kp<=1 and Vsw<=450km/s results in 25 days each of HSS (red) and slow speed wind (blue) conditions. Averages from daily values are: 10.7 cm flux 72.8, 74.3; Kp2.79, 0.46; BznT-0.08, +0.09; Vsw km/s 606, 359. Neutral densities at 400 km are higher for HSS (*) than for slow Vsw (squares).
HSS (Kp>=2) and Slow Vsw (Kp<=1) The TEC for moderate Kp>=2 (HSS) is slightly larger than for low Kp<=1 (slow Vsw)
CHAMP 400 km Neutral Densities Have pronounced HSS peaks in the sunrise (ascending) and sunset (descending) ‘global’ densities over 1 day.
CHAMP, MSIS, TIE Neutral Densities at CHAMP Hts (~337-368km) TIE-WT ~2x hi 2-8LT in quiet periods.
Empirical model of the equatorial vertical drift (Scherliess and Fejer, JGR, 104, 6829-6842, 1999. Drifts around the magnetic equator Can calculate the median vertical ion drift from the models and compare it to the quiet-time model as a function of LT and longitude at the magnetic equator. Results for TIEGCM Weimer TIMED lower boundary are fairly good. Usually active period (Kp~3-) larger magnitudes.
JicamarcaViz and Vi(+E) Drifts Daytime obs show Kp~3- Viz drifts are larger in magnitude before noon, and smaller after noon. Dec lunar semi-diurnal tide expects full and new moon +2m/s pre-noon.
IRI model TEC and %model/data shows IRI overestimates morning day and summer night TEC and underestimates winter night TEC. If model/data (M/D)>1, MPE=100 % (M/D-1) for average and for absolute ratio average for each glon. -100%(D/M-1) D>M
CTIPE TEC and %model/data shows CTIPE overestimates night TEC except in the winter high latitudes where TEC is underestimated.
TIEGCM HeelisKp model and %model/data shows TIEGCM/Kp overestimates lowlatitude pre-dawn, high latitude winter, and underestimates midlatitude night TEC.
Summary of TEC Climatology TIE-Kp CTIPE All models show different regions of overestimation and underestimation of the ‘real’ GPS TEC. All models but SAMI3 (hi) did best for at least 1 lon (TIE-Kp best for 4 lons) Average absolute value percent deviations for 61 days total, or 25 days of HSS or slow Vsw:IRI 93,99,104%; CTIPe 94,108,99%; TIE-Kp 76,77,84%, TIE-WT 90,90,93%, SAMI3 129% TIE-Kp IRI TIE-WT TIE-Kp TIE-Kp TIE-Kp IRI
SAMIE3 higher anomaly TEC than IGS, lower night TEC mid-lats. Summary of IGS TEC: SAMI3 36%(hi), CTIPe 80%(lo), IRI 88%(lo), TIE-Kp 112%(lo), TIE-WT 159%(lo).
Summary of NmF2 Climatology The regions of over- and under- estimates for NmF2 was sometimes the same as for TEC and often different. IRI was the clear winner, with CTIPe doing next best. Average absolute percent deviations: IRI 36%, CTIPE 61%, TIE-Kp 89%, TIE-WT 93%.
CTIPe Summary of HmF2 Climatology IRI CTIPe CTIPe CTIPe and IRI were close, where CTIPe was best for 5 longitudes, while IRI was best for 3 longitudes Average absolute model-data deviations in km were: IRI 25km, CTIPE 23km, TIE-Kp 35km, TIE-WT 38km CTIPe CTIPe IRI IRI
Summary of the First CCMC Climatology Study • model performance depends on • - latitude • - season • - local time • - data set • none of models ranks at the top for all used data sets • IRI best for NmF2, near best for hmF2, and in middle for TEC • establishes a baseline for new models and future versions • neutral densities and daily glon-24h TEC vary with Kp (and HSS or Vsw) in both data and models. • Jicamarca vertical drifts show Kp~3- larger before noon and smaller after noon, but this is at least partially semi-diurnal lunar tides in Nov-Jan. • More data sets and models are welcome for the future climatology CCMC Challenge at the 2012 CEDAR Workshop.
Future Participants *Geoff Crowley (gcrowley@astraspace.net) for TIME-GCM/AMIE runs *Michael.David@aggiemail.usu.edu for TDIM USU runs *AndrzejKrankowsi (kand@uwm.edu.pl) for IGS TEC (>=1994 5deg glon+2.5deg glat at 15min, 1h, or 2h intervals) *Aaron Ridley (ridley@umich.edu) for GITM runs *ludger.scherliess@usu.edu for COSMIC NmF2/hmF2 for different Kp and GAIM runs *Eric.Sutton@kirtland.af.mil for eddylb + Weimer05 TIEGCM runs *elsayed.talaat@jhuapl.edu for TIEGCM + SABER *Dan Weimer (dweimer@vt.edu) for runs of his Weimer+Jacchia+Bowman models for 400 km neutral density *Michael Wiltberger (wiltbemj@ucar.edu) for CMIT-TIEGCM model *Shunrong Zhang (shunrong@haystack.edu) for ISR model runs