Download
1 / 16
160 likes | 269 Views
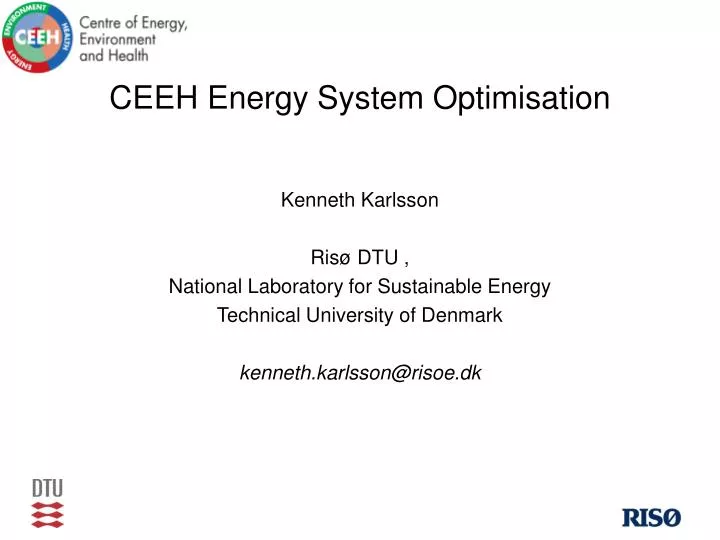
CEEH Energy System Optimisation. Kenneth Karlsson Risø DTU , National Laboratory for Sustainable Energy Technical University of Denmark kenneth.karlsson@risoe.dk. Optimisation loop. Externalities. Emissions. Energy System model. Economic development etc.

E N D
CEEH Energy System Optimisation Kenneth Karlsson Risø DTU , National Laboratory for Sustainable Energy Technical University of Denmark kenneth.karlsson@risoe.dk
Optimisation loop Externalities Emissions Energy System model Economic development etc.
Centre for Energy, Environment and Health Energy System Modelling – 2005 to 2050 System prices electricity district heat hydrogen biofuels Energy demand: Transport energy Electricity Heat Fuels - from all sectors Energy supply: Power plants Boilers Energy storage Hydrogen production Bio-fuels Macro economic factors Energy demand System optimization by minimising total system costs Fuel prices Hardware prices Externalities Costs of other externalities (climate change, nature etc.) Costs of health related externalities
Balmorel • Geography • Countries • regions • areas • Time resolution • e.g. 5 years step simulation • 52 weeks with 5 time steps • Endogenous investments • power/heating plants • heat storage • electrolysers, heat pumps • transmission lines …etc.
Balmorel • Linear optimisation model of the energy system • Minimising total yearly costs in the system • Constraints – balance equations, like: • power balance (at any time step production has to equal demand) • heat balance • hydrogen balance etc. and limitations, like: • resource limits (e.g. max available biomass resource)
Fuel costs, investment costs, taxes, externalities Car Bus Train Air Sea Energy production people Electricity District heat Hydrogen Bio-fuels Transport Appliances Heat loss Heat supply Household Trucks Vans Train Sea Air goods Appliances Heat loss Heat supply Proces energy Industry, trade and service Air emissions and waste products
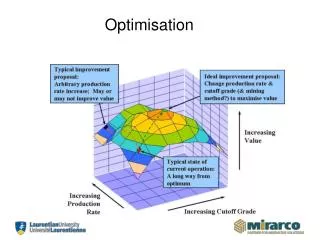
Linear optimisation models • Will always choose the cheapest solution • If no restrictions/constraints, there will be one dominating technology • Example of change in costs for power producing technologies when including externalities – using www.recabs.org
www.recabs.org Biomass Offshore wind Gas CC CHP Coal CHP
www.recabs.org Biomass Offshore wind Gas CC CHP Coal CHP
Some Balmorel results Wind and biomass CO2-price = 300 DKK/t ~ 40 €/t
Some Balmorel results Wind and coal CO2-price = 150 DKK/t ~ 20 €/t
Seeking Collaboration Partners Within CEEH Outside CEEH Global/regional air pollution modelling Global energy and emission scenarios Regional/local air pollution modelling regional energy/emission scenarios Effects in Denmark “Optimal” future energy system
Global scenarios IPCC Balmorel (www.balmorel.com) Boundary conditions