Download
1 / 13
130 likes | 539 Views
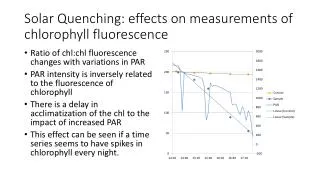
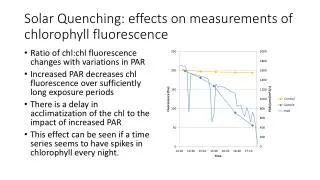
Modelling GPP and chlorophyll fluorescence. Christiaan van der Tol Wouter Verhoef Joris Timmermans ITC International Institute for Geo-Information Science and Earth Observation Anne Verhoef The University of Reading. Observations (maps). Radiance spectra. Model. interpretation.

E N D
Modelling GPP and chlorophyll fluorescence Christiaan van der Tol Wouter Verhoef Joris Timmermans ITC International Institute for Geo-Information Science and Earth Observation Anne Verhoef The University of Reading
Observations (maps) Radiance spectra Model interpretation Plant physiological, Meteorological and Hydrological processes Processes (time series)
SCOPE Soil Canopy Observation of Photosynthesis and the Energy balance Observations (maps) Radiance spectra Parameters p1 interpretation Parameters p2 Plant physiological, Meteorological and Hydrological processes Processes (time series)
SCOPE Soil Canopy Observation of Photosynthesis and the Energy balance Observations (maps) Radiance spectra model inversion Parameters p1 Stochastic correlation interpretation Parameters p2 Plant physiological, Meteorological and Hydrological processes Processes (time series)
Directional effects Optical Thermal Fluorescence
PAR photosynthesis reflectance humidity temperature fluorescence fluorescence heat dissipation transmittance Lf= 1 2 all visible leaves input spectrum Fluorescence leaf level 2 FLUSPECT model: observation model for the leaf 1 TVR model: biochemical model for the leaf Van der Tol, Verhoef & Rosema, AFM 149, pp. 96-105, 2009 canopy level
Fluorescence aPAR insufficient to predict GPP Fluorescence insufficient to explain GPP simulations for a large range of parameter values and weather conditions GPP versus TOC fluorescence GPP versus aPAR
Fluorescence aPAR + fluoresence sufficient to explain GPP simulations for a large range of parameter values and weather conditions GPP versus TOC fluorescence yield Blue: high Fluorescence / aPAR ratio Red: low Fluorescence / aPAR ratio
Energy balance Brightness temperature used to tune stomatal resistance SCOPE simulates the distribution of sensible and latent heat simulations for a field experiment in Barrax, Spain (2004)
Developments • Better integration of FLUSPECT & PROSPECT with and biochemical model • MODTRAN library • Soil spectral library • Inversion algorithms • Web site
Thank you • Christiaan van der Tol: tol@itc.nl • Wout Verhoef: verhoef@itc.nl • Joris Timmermans: j_timmermans@itc.nl • Anne Verhoef: a.verhoef@reading.ac.uk