Download
1 / 52
550 likes | 863 Views
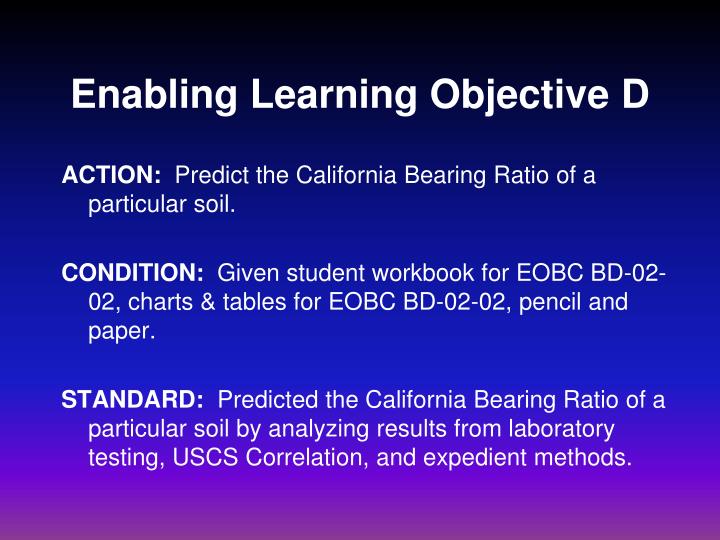
Enabling Learning Objective D. ACTION: Predict the California Bearing Ratio of a particular soil. CONDITION: Given student workbook for EOBC BD-02-02, charts & tables for EOBC BD-02-02, pencil and paper.

E N D
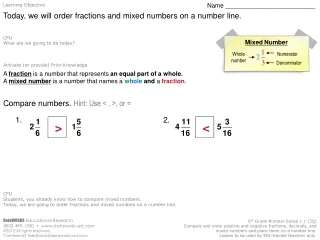
Enabling Learning Objective D ACTION: Predict the California Bearing Ratio of a particular soil. CONDITION: Given student workbook for EOBC BD-02-02, charts & tables for EOBC BD-02-02, pencil and paper. STANDARD: Predicted the California Bearing Ratio of a particular soil by analyzing results from laboratory testing, USCS Correlation, and expedient methods.
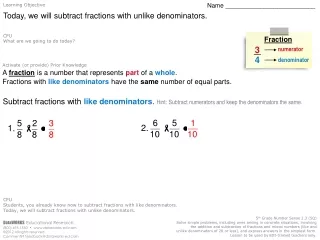
Terminology • CBR - California Bearing Ratio • MMC - Minimum Moisture Content • OMC - Optimum Moisture Content • MDD - Maximum Dry Density • BPL - Blows Per Layer • CE - Compaction Effort • CE56 - Compaction Effort, 56 Blows Per Layer • Specification Block - The range where dry density within 5% and moisture content within 4% come together to determine project requirements. Pg 26 SH
Actual Stress CBR = X 100 Standard Stress CBR Defined A soil’s ability to support a load based on its strength relative to a limestone standard. CBR measures the shearing resistance of a soil under controlled conditions of density and moisture content. Pg 27 SH
Limestone penetration curve based on 3/4" aggregate CBR Relationship Curve 1500 1000 Stress (Psi) 500 .2 .1 Penetration (in) Pg 27 SH
250 .1" 500 x 100 = 25 .2" x 100 = 33.3 1000 1500 CBR Relationship Curve 1500 Limestone Standard 1000 Stress (Psi) 500 250 .2 .1 Penetration (in) Pg 27 SH
CBR Test in Progress Dr. Doug Dert Dr. Ima Knird
CBR Testing Procedures • Compaction Test: Requires 3 separate tests (12, 26, & 56 BPL). 5 molds required for each test , for a total of 15 tests per sample. • Plot density and moisture curves • Soak CBR mold for 4 days in water with surcharge weights that simulate a weight equal to the expected pavement/base weight. Pg 28 SH
Soak the mold for 4 days Pg 28 SH
Three Soil Groups • Free-Draining (Sand) • Swelling (Clay) • Non-Swelling (Silt) Pg 30 SH
Compaction Curves • U-Shaped Curves: Free-Draining Soils • Bell-Shaped Curves: Swelling & Non-Swelling Soils FM 5-410 Military Soils Engineering Page 8-10, Figure 8-5 (CBR Design Flowchart) or Page 8 of Charts and Tables Pg 31 SH
140 105% MDD= 137.6 pcf Specification Block MDD= 131 pcf 130 DRY UNIT WEIGHT (Pounds per cubic feet) 120 MMC= 9.7% MMC+4%=13.7% 110 3 7 11 15 Free-Draining Soil • FM 5-410, Military Soils Engineering, Page 8-10, Fig 8-5. • U-Shaped Curve • Free-Draining Soil • Peak of curve is MDD • WC at peak is MMC • Moisture range is MMC+4% • Density range is MDD to 105% MDD Pg 9 C&T, Pg 31 SH MOISTURE (water) CONTENT (Percent of dry weight)
Swelling Soils Soil that has more than a 3% volume change with the addition of water FLEX PAVEMENT BASE COURSE SUBBASE SUBGRADE, CLAY, PI = 35 CAPILLARY RISE Pg 30 SH
Swelling Soils The Army standards permits no more than a 3% swell to occur after a soil has been placed and compacted. Therefore swelling soils must be pre-swelled to a moisture content that will result in < 3% swell FLEX PAVEMENT CAPILLARY RISE Pg 30 SH
Other characteristics of a swelling soil Plasticity Index 0 - 14: Non-swelling14 - 25: Marginal Swell25 - 40: Critical Swell > 40 : Excessive Swell PL LL PI Liquid State SolidState Plastic State
110 100 95% MDD= 97.85 pcf DRY UNIT WEIGHT (Pounds per cubic feet) Specification Block 90% MDD= 92.7 pcf 90 MMC= 17.6% MMC+4%=21.6% 80 12 16 20 24 Swelling Soil • Bell-Shaped Curve • Look at swell curve • Swell curve exceeds 3% at any point • Swelling soil • Peak of curve is MDD • Look at swell curve to determine MMC • Moisture range is MMC+4% • Density range is 90% to 95% MDD MDD=103 pcf Pg 9 C&T, Pg 31 SH MOISTURE (water) CONTENT (Percent of dry weight)
140 130 DRY UNIT WEIGHT (Pounds per cubic feet) 95% MDD= 122.74 pcf 120 Specification Block 90% MDD= 116.28 pcf 0MC= 9.1% OMC–2%= 7.1% 0MC+2%=11.1% 110 3 7 11 15 Non-Swelling SoilPI > 5 • Bell-Shaped Curve • Look at swell curve • Swell curve never exceeds 3% swell • Non-Swelling soil • Peak of curve is MDD • Water Content at peak is OMC • Moisture range is OMC +/-2% • If PI > 5, Density range is 90% to 95% MDD MDD=129.2 pcf Pg 9 C&T, Pg 31 SH MOISTURE (water) CONTENT (Percent of dry weight)
140 MDD=129.2 pcf 130 DRY UNIT WEIGHT (Pounds per cubic feet) Specification Block 95% MDD= 122.74 pcf 120 0MC= 9.1% OMC–2%= 7.1% 0MC+2%=11.1% 110 3 7 11 15 Non-Swelling SoilPI < 5, CBR < 20 • Bell-Shaped Curve • Look at swell curve • Swell curve never exceeds 3% swell • Non-Swelling soil • Peak of curve is MDD • Water Content at peak is OMC • Moisture range is OMC +/-2% • If PI < 5, CBR < 20,Density range is 95% MDD to MDD Pg 9 C&T, Pg 31 SH MOISTURE (water) CONTENT (Percent of dry weight)
140 105% MDD= 135.66 pcf Specification Block 130 MDD=129.2 pcf DRY UNIT WEIGHT (Pounds per cubic feet) 120 0MC= 9.1% OMC–2%= 7.1% 0MC+2%=11.1% 110 3 7 11 15 Non-Swelling SoilPI < 5, CBR > 20 • Bell-Shaped Curve • Look at swell curve • Swell curve never exceeds 3% swell • Non-Swelling soil • Peak of curve is MDD • Water Content at peak is OMC • Moisture range is OMC +/-2% • If PI < 5, CBR > 20,Density range is MDD to 105% MDD Pg 9 C&T, Pg 31 SH MOISTURE (water) CONTENT (Percent of dry weight)
140 130 DRY UNIT WEIGHT (Pounds per cubic feet) 120 110 3 7 11 15 Specification Block Anything plotted to the right of this line is too wet Anything plotted to the left of this line is too dry Anything plotted above this line is over compacted Specification Block Anything plotted below this line is under compacted Pg 34 SH MOISTURE (water) CONTENT (Percent of dry weight)
140 Too Much Compaction effort, water content good Too much time wasted, Adjust number of passes 130 Under compacted/ Too Dry Under compacted/ Too Wet DRY UNIT WEIGHT (Pounds per cubic feet) 120 Scarify, Add Water, Mix Soil, Retest, Re-compact, Retest. Scarify, Allow to dry, Re-Compact, Retest 110 3 7 11 15 Corrective Actions Specification Block MOISTURE (water) CONTENT (Percent of dry weight) Pg 32-34 SH
CBR Expedients • USCS Correlation • Pentrometers • Trafficability Test Set • Airfield Cone Pentrometer • Dual (Cone) Mass Pentrometer Pg 28 SH
USCS Correlation FM 5-410, Page 5-11, Table 5-3 Characteristics Pertinent to Roads & Airfields Examples: GW = 40 - 80 SW = 20 - 40 SC = 5 – 20 Note: If this method is used, assume lowest CBR value to be on the safe side.
Pentrometers • Trafficability Test Set: Used for sub grades only • Airfield Cone Pentrometer: Used for non-gravelly soils • Dual (Cone) Mass Pentrometer Used for all soil types
Summary & Review ACTION: Discuss the theory of California Bearing Ratio (CBR) and CBR expedients. • CBR Theory • CBR Timeline • 3 Soil Groups • Compaction Curves • Specification Block • CBR Expedients Questions?
Check on Learning Q: What does CBR stand for? A: California Bearing Ratio (PG 24) Q: You have a soil with the CBR of 80 available to be used as well as a soil with the CBR value of 40. Which soil is stronger A: CBR of 80 is stronger. The higher the CBR the stronger the soil, the lower the CBR the weaker. (PG 24) Q: If you test a road for compaction and you discover that you are too dry and under compacted, what steps would you take? A: Scarify, add water, mix soil, re-test moisture content, re-compact, re-test moisture content and density. (PG-31)
Enabling Learning Objective E ACTION: Develop a quality control plan for a horizontal construction project. CONDITION: Given student workbook for EOBC BD-02-02, charts & tables for EOBC BD-02-02, pencil and paper. STANDARD: Developed a quality control plan for a horizontal construction project to include: Identified equipment available and equipment needed to test and adjust a particular soils density and moisture content
Density Testing Equipment • Sand Cone Method • MC-1 Nuclear Moisture-and-Density Tester (Nuke Gauge) • Common Sense Pg 29 Workbook
Nuclear Moisture-and-Density Tester “Nuke Gauge”
Nuclear Densometer Provides both moisture and density determination MC-1 TROXLER 6 - 8”
Nuclear Densometer RADIOACTIVE MATERIAL Cesium (Cs) 137 and Americium (Am) 241
Nuke Nuclear Densometer WARNING: Operator must wear badge. WARNING: Operator must be trained. WARNING: Gauge must be stored in locked, unoccupied and isolated areas. More information: TM 5-6635-386-12&P
Common Sense • Does soil appear to be too wet or too dry? • Is compaction equipment “Riding Out”? • Does equipment “Pump” as it drives over? • CE56 results are not needed
Compactor, Tamping Foot Sheepsfoot Roller Smooth-drum Vibratory 9-Wheel Pneumatic Compaction Equipment
Model 1602 Water Distributor CAT 130G Grader Other Equipment(Used to adjust moisture content)
Equipment Selection FM 5-410, Page 8-13, Table 8-3 Soil classification and compaction requirements (average) If soil classification is GP (Poorly graded gravel) would you use a towed sheepsfoot roller to compact? No, Table 8-3 does not recommend using this type of compaction equipment for this type of soil
Equipment Selection Factors to consider when selecting compaction equipment include but are not limited to: • Type of soil • Desired density • Desired lift thickness • Numbers of passes required • Size of the project • Phase of construction (grade, sub-grade, base) • Available equipment Pg 29 Workbook
T/O Quality Control • Use test strips • Test each lift after compaction • Test roads and airfields every 250 linear feet • Stagger tests on each side of the centerline • Test parking lots every 250 square yards • If initial checks are satisfactory increase distance Pg 29 Workbook
Test Strip Used to determine best roller to use, amount of moisture that needs to be added, and amount of passes needed by the selected piece of equipment. 40 to 100 yards Typical 6” lift thickness 6 Yards
Test Strip • Determines the correct equipment and equipment effort needed for the job at hand. • A test strip is used to determine the best suited compaction equipment for your project. • It determines the amount of passes necessary to attain the proper density of the soil. • Test strip helps to determine the optimum thickness of each lift.
V V T T V T P V P T P P QC Plan Development(using test strip data) 140 100 % 135 95 % 130 Dry Density 125 90 % 120 115 110 0 1 2 3 4 # of Passes P - PNUEMATICT - TAMPING FOOTV - VIBRATORY Pg 30 Workbook