Download
1 / 10
100 likes | 264 Views
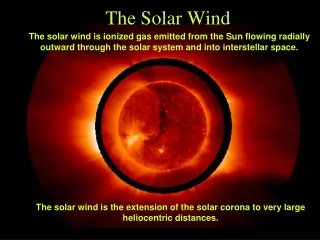
Suprathermal Tails in Solar Wind Oxygen and Iron. Mark Popecki University of New Hampshire STEREO SWG 11/2007. ACE News #98. Solar Wind Heavy Ion S/T Tails. High speed tails have been observed in solar wind H+ and He++, as well as in pickup He+ (Gloeckler, Gloeckler & Mason).

E N D
Suprathermal Tails in Solar Wind Oxygen and Iron Mark Popecki University of New Hampshire STEREO SWG 11/2007
ACE News #98 Solar Wind Heavy Ion S/T Tails • High speed tails have been observed in solar wind H+ and He++, as well as in pickup He+ (Gloeckler, Gloeckler & Mason). • Tails have implications for particle injection into the shock acceleration process. • Investigate heavy ion speeds; characterize possible tails in ions heavier than He. • Energy spectrum of solar wind O and Fe shown here from day 2007/059 (Feb. 28) • Counts vs. Energy/charge • Preliminary estimate of Fe charge state composition -> extract speed from Energy/charge spectrum.
Switch from large to small aperture O Fe He+ pickup ions He2+ H+ 78 keV/e 1 keV/e sweep PLASTIC: Detection of Heavy Ions • PLASTIC heavy ion detection makes use of: • E/Q selection (ESA, electrostatic analyzer) • Time of flight • Energy (ssd) • Measurements: • Energy, mass, ionic charge • One minute cycle • A voltage is applied to the ESA, thereby selecting the E/e ratio of incoming ions • ESA voltage is swept from high to low in a one minute cycle. • This selects the highest energy/charge ions first, then progressively lower energy/charge ions • Heavy ions appear in sweep in order of E/q. • Data flow • All ions are counted and identified. • Selected event data are telemetered to ground based on a priority system.
FM1 2007/059 Feb 28 Fe 10+ He+ O 6+ H+ 78 keV/e 1 keV/e Ion Trails in Time of Flight and Energy Step • Ion data shown for 2007/059 A • Pulse height data plotted in Time of Flight (TOF) vs. ESA step (E/e). • Traces show expected trails of Fe10+, O6+, He+ and H+ • Vertical red bars represent high count rates for He2+ and H+ • Aperture switch occurs at the first high intensity step to manage high rates.
ESA steps 23-27 23.8-28.8 keV/e Fe O H+ He A 2007/059 ESA Steps 30-31 19.6-20.6 keV/e Fe O 10+ 8+ H+ He Example: Solar Wind Fe Ions 2007/059 • Pulse height data are shown from high energy E/e steps in Time of Flight (TOF) vs. Energy (E) • He+ and Fe ions are detected in these steps. • Average Fe charge state appears to be approximately 8+ (preliminary). • Obtain energy spectrum of heavy ions: • Count Fe pulse height events • Reconstruct the incoming ion count, using pulse height count and rate data.
Energy/charge Spectrum of Solar Wind O and Fe Ahead 2007/059 Feb 28 • O and Fe counts are shown vs. Energy/charge. • The average H+ energy was 2 keV/e (~650 km/s) • If all solar wind ions travel at approximately the same speed, • A 9+ Fe ion would have an energy/e of 12.4 keV/e. • A 6+ O would have an energy of 5.3 keV/e. • Although the O and Fe have speeds similar to the solar wind H, both display high energy tails. • Add charge state information to estimate ratio of heavy ion speed to H speed
Modeled PLASTIC Essd and TOF response for Fe 7, 9 & 11+ at 20.6 keV/e (ESA step 30) Fe 11+ • Picture showing surface plot of multiple Q states • Smaller range (0-500 ch) pictures of model E and TOF histograms Fe 9+ Fe 7+ Preliminary Fe Charge State Composition • Model a single Fe ion in TOF and Essd • Include effects of: • Energy loss and as ion goes through carbon foil • Scattered flight path after foil • Pulse height defect in SSD • Energy (ssd) and TOF calibration • Preliminary charge state estimate for Fe in ESA step 30-31 range: 8+
ESA steps 30-31 19.6-20.6 keV/e ESA steps 23-27 23.8-28.8 keV/e Fe Charge State Estimation • The solar wind Fe charge state was calculated in two energy ranges: • 19.6-20.6 keV/e (ESA steps 30-31 • 23.8-28.8 keV/e (ESA steps 23-27)
Summary • The energy/e spectrum of solar wind O and Fe has been calculated for 2007/059 (Feb. 28) • Both O and Fe count spectra display tails above the H+ solar wind speed. • An estimate of Fe charge state composition indicates that the solar wind Fe is present at speeds up to 1.3 to 1.5 times the H+ speed. Longer accumulations can extend the speed range for study.