Download

1 / 39
390 likes | 537 Views
Presentation on Indian Power Sector. Government of India June, 2006. Installed Capacity of Power (May , 2006). Generating Capacity Hydro 32,335 MW (26%)

E N D
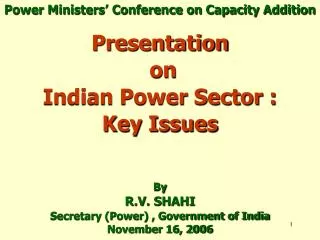
Presentation on Indian Power Sector Government of India June, 2006
Installed Capacity of Power (May , 2006) Generating Capacity Hydro 32,335 MW (26%) Thermal 82,507 MW (66%) Coal 68,643 MW Gas 12,663 MW Nuclear 3,850 MW (3%) Renewables 6,158 MW (5%) TOTAL 1,24,850 MW (13,420 MW) (40,448 MW) (70,982 MW) In addition captive generation capacity of appx. 41,000 MW.
Growth of Power Sector To Electrify these Rural Households ( 78 million) in next five years, Rajiv Gandhi Gramin Vidyutikaran yojana has been launched.
Per Capita Consumption of Electricity in India (kWh/year) 606 In 1950 Electricity consumption per capita was 15 kwh In 2012 it is projected at 1000 kwh. Brazil : 2070 China : 1200 Thailand : 2000 Malaysia : 3000
Challenges and Policy Responses • Eliminating Shortages- Peaking 11.7%, Energy 7.3%. • Stepping up Public Investments. • - Adding 1,00,000 MW capacity by 2012. • Nurturing Private Sector- Present share 11%. • Electricity Act –2003 and National Electricity Policy. • Rural Electrification- 56% Rural households yet to electrified. • Completion of electrification in next five years. • Financial Viability- SEB losses though reducing , yet very high. • Distribution Reforms : Reduction in Aggregate Technical and Commercial (AT&C) losses; Improving quality of supply.
Improving Investment Climate • At present 40,000 MW generation capacity is already under execution. Investment of USD 43 Billion committed. • Public sector investments have been stepped up ; will need to be supplemented through private investments. • 100 % FDI in all segments of Power Sector has been allowed. • Recently Power Trading also covered for 100% FDI. • Level playing field for both domestic and International Investors.
Electricity Act 2003 • The Act creates a liberal and transparent framework for Power Development. • It facilitates investment by creating competitive environment and reforming distribution segment of power industry. • Entry Barriers removed/reduced • Delicensed generation. • Freedom to captive generation including group captive. • Recognizing trading as an independent activity. • Open access in transmission already in place. • Open access to consumers above 1 MW within five years commencing from 27th Jan 2004 (date of enforcement of amendment to Electricity Act). • Multiple licenses in distribution. • Regulatory Commissions- to develop market to fix tariff.
Implementation of the Electricity Act • Most of the Rules (required to be framed by Central Govt.) notified. • National Electricity Policy announced: Feb, 2005 • Electricity Appellate Tribunal : Operational July, 2005. • Guidelines for determining tariff through competitive bidding notified:Jan 2005 • Regional Power Committees for all the 5 regions established: May 2005 • Electricity/Tariff policy notified : Jan 2006 • CERC has notified open access in transmission: Jan, 2004 • Guidelines for private investment in transmission: April 2006 • Several SERCs have initiated action on open access in Distribution.
National Electricity Policy By year 2012 : • Per capita availability 1000 units. • Installed capacity over 200,000 MW. • Spinning reserves 5% . • Minimum lifeline consumption of one unit per household per day. • Inter-regional transmission capacity 37,000 MW. • Energy efficiency/ conservation savings about 15%. • Quality and reliable power supply.
Tariff Policy • Tariff of all Generation and Transmission Projects in Private Sector through Competitive route- Public sector to complete transition in five years. • Reduction of cross subsidy to (+)(-) 20% in next five years. • Emphasis on facilitating Open Access in Distribution; clear formulation on cross subsidy surcharge. • Transmission Tariff framework sensitive to distance and direction. • Strict Implementation of Performance Standards. • Agriculture Tariff to leverage sustainable use of Ground Water Resources. • Time bound introduction of MYT.
Meeting the Demand • Peak demand estimation : • End of XI plan (2012) - 157 GW. • End of XII plan (2017) - 213 GW. • For next 30 years , capacity will need to be doubled every 10 years. • Full Development of Hydro potential . • All Hydro is Renewable irrespective of size. • 50,000 MW Hydro Initiative launched. • 73 projects with capacity of 33,000 MW taken up for DPR preparation. • 100,000 MW Thermal Initiative launched. Contd..
Capacity Addition During X Plan (2002-2007) *Out of this about 3300 MW are being attempted under the best efforts scenario and in case of their slippage they are expected to be commissioned by the end of Qtr- I, 2007-08.
Capacity Addition Programme During XI Plan (2007-2012) (MW) • May be revised to 67,000 MW, depending on the availability of Gas/ LNG in required quantities and right prices. • In addition, 5000 MW through Non- Conventional Energy Sources. • Captive capacity not included.
Investment Requirements During XI Plan (2007-2012) • USD 50 Billion for Generation. • Another USD 50 Billion for Transmission, Distribution and Rural Electrification. • Total USD 100 Billion.
New Benchmarks in Setting Power Units • Coal Based • The Average lead time for the 500 MW unit reduced from 49 months to 38 months. • The Average lead time for the 210/250 MW units reduced form 32 months to 28 months. • NTPC emerged as Globally competitive player as cost of generation is among the lowest • Gas Based • Average lead time for gas based project has come down from 24 months to 20 months.
Private Participation- Generation • Encouraging response of investors • Financial closure of 4400 MW projects– investment of about USD 3.6 Billion. • Financial closures for 2200 MW is at advanced stage of finalisation. • Additional about 10,000 MW appraised. Fuel supply availability critical for financial closure.
Ultra Mega Power Projects – A Major Investment Initiative • Section 63 of the Electricity Act, 2003, envisages procurement of power by distribution licensees through competitive bidding. • Tariff so arrived is to be accepted by Regulatory Commission. • National Electricity Policy provides for “ Competition aimed at consumer benefits” – Competition to determine the price as apposed to cost plus exercise. • Electricity Tariff Policy stipulates competitive procurement of future power requirements by Distribution Licensees. Contd..
Ultra Mega Power Projects contd.. • Will facilitate setting up of large sized projects of 4000 MW each reaping economies of scale and quick capacity addition leading to cheaper power. • Utilization of latest highly efficient super critical technology. • IPP experience highlights critical importance for Government intervention to • secure reliable fuel supply, • obtain environmental clearances • co-ordination with states & bulk power purchasers, for achieving financial closure.
The Shell Company Concept (SPV) • Shell company to work independently to reach a stage where major tie-ups, statutory clearances and linkages are in place. • PFC nominated as the nodal agency for setting up shell companies. • Each company headed by a Chief Executive. • Selection of developer through a Tariff based ICB. • Shell companies will be then transferred to the successful bidders for execution. • With a number of concerns addressed by Shell company, risk factors minimised.
Role of Shell Company • SPVs to take actions for : • Preparation of project report. • Land acquisition. • Allocation of fuel linkages/coal blocks. • Allocation of water by the state Govt. • Appointment of consultants for Environment Impact Analysis (EIA) & Project Report. • Appointment of consultants for International Competitive Bidding (ICB) document preparation & evaluation of bids. Contd.
Role of Shell Company contd.. • Various approvals and statutory clearances. • Off-take/sale of power – section 63 of Electricity Act, 2003 provision. • Power Evacuation/ (Transmission) System.
Role of Ministry of Power • To be a facilitator. • Co-ordination with concerned Ministry/ Agencies for ensuring: • Coal Block Allotment/ Coal Linkage • Environment/ Forest clearances • Required support from State Govt. Agencies • Financial Institutions towards financial closure. • To facilitate PPA and proper payment security mechanism - with State Govt./ State utilities • Monitoring the progress of shell companies w.r.t. predetermined timelines.
Present Status • Seven Projects have been identified: 1. Sasan Power Limited (M.P.) - Coal pit head 2. Akaltara Power Limited (C.G.) - Coal pit head 3. Coastal Gujarat Power Limited (Mundra) 4. Coastal Karnataka Power Limited (Tadri) 5. Coastal Maharashtra Power Limited (Girye) 6. Coastal A.P. (Krishnapatnam) 7. Orissa- Coal pit head Contd.
Present Status contd.. • EOI advertised for projects at Sasan, Mundra, Tadri and Girye. • Pre- Bid Conference held on 21.02.2006 at New Delhi and 17.4.2006 at Mumbai. • RFQ invited for Sasan and Mundra Projects • Federation of Indian Chamber of Commerce and industry (FICCI) selected Industry Partner.
Payment Security Mechanism • As condition in PPA. • Letter of credit (LC) by distribution licensee. • Escrow Account claims of receivables of distribution utility. • Finally in the unlikely event of default direct supply to HT consumers as per provision of the Electricity Act, 2003.
Important Milestones For Selection Process Milestones in respect of Akaltara and Tadri would be finalised after availability of key inputs from State Govts.
Investment Opportunities • Investment opportunities for about USD 3.0 Billion in each project. • Long term Bond market and take out financing for better tariff is being proposed. • The sectoral capping and the group exposure capping for the purpose of debt financing, expected to be revisited and properly enhanced exclusively for these Ultra Mega Projects. Contd.
Augmentation of National Grid • Intra – Regional expansion of transmission capacity is linked to generation projects. • Inter- Regional connectivity has been planned with hybrid systems, consisting of HVDC, Ultra- High Voltage AC (765 kV) & Extra High Voltage AC (400 kV) lines. • Present Inter- Regional transfer capacity is 9,500 MW, being enhanced to 17,000 MW by 2007. • 37,000 MW by 2012.
Private Participation in Transmission • The Act provides: • Dedicated transmission line can be set up by generating company or captive plant owner without any license • For granting license for inter – State or intra- State transmission, theRegulator shall consider recommendation of CTU/STU. However, such recommendation is not binding on the Regulator. • Policy frame work developed for facilitating Private Participation through Empowered Committee. • Advance Project formulation to speed up projects through this route. • Project developers to be selected on the basis of competitive bidding for tariff. • Guidelines for competitive tariff determination notified.
Payment of Bills by State Utilities to CPSUs • Since 2003-04, the realisation of dues by CPSUs improved to about 100% of current billing. • 2001-02 76% • 2002-03 95% • 2003-04 Almost 100% • 2004-05 Almost 100% • 2005-06 Almost 100% • Full payment to all private companies. • Agreement on Securitisation of dues of CPSUs were finalised in 2002-03. States have issued bonds. • No NPA to PFC.
Commercial Losses of State Utilities as % of Turnover (Without Subsidy) Years
Revenue Gap (Cents/ kWh) Difference between Average Cost of Supply (ACS) and Average Revenue Realised (ARR) Years
Tariff Rationalisation and Improved Collection Efficiency Average Revenue Realised (ARR) (Cents/ kWh) Years
Rural electricity infrastructure initiative In five years…… • Electrify all villages and habitations. • Provide access to electricity to all households. • Give Electricity Connection to Below Poverty Line (BPL) families free of charge. And also to cater to the requirements of household needs, Agricultural infrastructure, Agro based industries, commerce & Social Services – Health, Education
Rural Electrification Features • The scheme covers the entire country. • Provides 905 grant and 10% loan from the central Government. • USD 3.6 Billion outlay for the entire scheme. • USD 1.1 Billion provided the current Tenth Five Year Plan. • Emphasis on decentralized distributed generation & • Decentralised management by Franchisees, Co-operatives, Panchayats etc.
Clean Development Mechanism (CDM) Projects • India emerging as one of the largest potential source of Certified Emission Reductions (CER). • Designated National Authority fully functional. • The Host Country Approval (HCA) was accorded to 297 projects in Energy sector under CDM. • 63 projects have been registered – creating 9 million plus CERs. • Focus areas in Energy sector : • R&M of old plants. • Conversion of LT to HT lines. • Supercritical Thermal Power Projects. • Hydro Projects.
THANK YOU http://powermin.gov.in