Download
1 / 54
590 likes | 872 Views
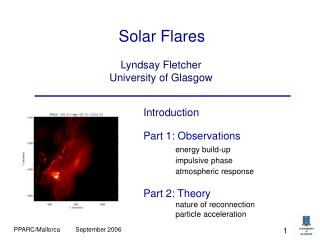
Super-Hot Thermal Plasmas in Solar Flares. Amir Caspi Research advisor: R.P. Lin. Why study solar flares?. The most powerful explosions in the solar system - energies of up to 10 9 -10 10 H-bombs!

E N D
Super-Hot Thermal Plasmasin Solar Flares Amir Caspi Research advisor: R.P. Lin
Why study solar flares? • The most powerful explosions in the solar system - energies of up to 109-1010 H-bombs! • Provide a “local” laboratory to explore the physics that govern other astrophysical phenomena (stellar flares, accretion disks, etc.) • Allow us to explore plasma physics in regimes not (easily) re-creatable in the lab
“Typical” flare characteristics • Durations of 100-1000 seconds • Electrons and ions accelerated up to 100s of MeV and 10s of GeV (respectively) • Plasma temperatures up to 10-50 MK • Densities of ~1010 to ~1012 cm-3 • Energy content up to ~1032-1033 ergs • Generally, loop structure with thermal emission from the looptop, non-thermal emission from footpoints
Open questions • Evolution of the thermal plasma • What are the dominant heating mechanisms, especially for super-hot (T > 30 MK) plasmas? • Where does heating occur? • Is there a fundamental limit on the plasma temperature? • What is the relationship between the thermal plasma and accelerated particles? • Energetics • How much energy contained in thermal electrons? • Compared to the energy in accelerated electrons (and ions)?
X-ray emission mechanisms • Electron bremsstrahlung (free-free continuum emission) • Radiative recombination (free-bound continuum emission) • Electron excitation & decay (bound-bound line emission)
Free-free (bremsstrahlung) • Thermal: Maxwellian electron distribution yields • Nonthermal: “injected” electron spectrum yields
Free-bound & bound-bound • Free-bound continuum: free (thermal) electrons recombine and emit a photon of energy • Bound-bound lines: bound electron excited (primarily through collisions with ambient free electrons) and de-excites via emission of a photon of energy • Line profile (peak energy, FWHM, amplitude, shape) depends on T, v, n • In X-rays, primary solar lines are from ions of O, Si, Ca, Fe, and Ni
X-ray Flare Classification • Photometers on board the GOES satellites monitor solar soft X-rays • GOES class is determined by peak flux in the 1-8Å channel • Rough correlation between GOES class and temperature, energy
X-ray Flare Phases • Impulsive (rise) phase - bursty HXR, fast but smoothly rising SXR • Gradual (decay) phase - little to no HXR, gradual decline in SXR • Pre-impulsive gradual rise observed in some flares
Early X-Ray Observations • Balloon, rocket, satellite • Broadband spectrometers • Bragg crystal (narrowband) spectrometers • Broadband imagers • Instrumental limitations • BBS: coarse energy resolution allowed interpretation of HXR spectra as thermal w/ T > 100 MK • BCS: lines suggested T ~ 20 MK • No “complete” picture of flare emission (Crannell et al. 1978)
X-Ray Observations: TNG • Germanium detectors: much higher broadband spectral resolution • Allow more accurate ID of thermal vs. non-thermal emission • First results • HXR emission likely non-thermal • Emission from “super-hot” (T > 30 MK) thermal component • RHESSI offers the first “complete” picture of flare emission: SXR/HXR continuum and line emission, plus imaging in arbitrary energy bands (Lin et al. 1981)
Benefits of RHESSI • Good spectral resolution - can distinguish between thermal/non-thermal emission • Good temporal resolution - can observe evolution of spectra over short times • Good angular resolution - can distinguish spatially-separate sources (and do spectroscopy) • First broadband instrument with simultaneous spectral and imaging observations of continuum (thermal + nonthermal) and lines • Now have multiple measurements of thermal emission
Fe & Fe/Ni line complexes • Line(s) are visible in almost all RHESSI flare spectra • Fluxes and equivalent width of lines are strongly temperature-dependent (Phillips 2004)
Fe & Fe/Ni line complexes • Differing temperature profiles of line complexes suggests ratio is unique determination of isothermal temperature (Phillips 2004) • Only weakly dependent on abundances
Fe & Fe/Ni line complexes • Lines are cospatial with thermal continuum source • No significant emission from footpoints • Lines are a probe of the same thermal plasma that generates the continuum • We can directly compare continuum temperature to line-ratio temperature
Analytical method • Fit spectra with isothermal continuum, 3 Gaussians, and power law • Calculate temperature from fit line ratio; may also calculate emission measure & equiv. widths from line fluxes • Compare to continuum temperature
Fe Equivalent Width vs. Temperature • Method of Phillips et al. (2005) • Defined as integrated line flux divided by continuum flux (at peak energy) • Compared to predictions, trend is opposite from ratio temperatures • Not independent of abundances
23 July 2002: Pre-impulsive phase • Fit equally well with or without thermal continuum! • Iron lines indicate thermal plasma must be present, but much cooler than continuum fit implies
Flux Ratio vs. Temperature … small contribution • Possible explanations: • Instrumental effects and coupled errors in multi-parameter fits • Ionization non-equilibrium • Incorrect assumptions about ionization fractions • Multi-thermal temperature distribution … unlikely … possible … needs further investigation
Emissivity vs. Temperature … small contribution • Possible explanations: • Instrumental effects and coupled errors in multi-parameter fits • Ionization non-equilibrium • Multi-thermal temperature distribution • Incorrect assumptions about ionization fractions • Line excitation by non-thermal electrons • Abundance variations during the flare … unlikely … needs further investigation
Conclusions • Fe & Fe/Ni line complexes provide a probe of the thermal plasma in addition to continuum emission • Help constrain fits to thermal continuum • Provide thermal information even when continuum is difficult to analyze • Not all flares exhibit the same line/continuum relationship • May suggest different temperature distributions • Other differences (e.g. spectral hardness) may contribute • Ratio & equivalent width results are not self-consistent • Suggests theoretical predications may need corrections • Assumptions about ionization fractions may be incorrect
Future Work • Statistical survey of Fe & Fe/Ni emission in M/X flares • Differential Emission Measure (DEM) analysis • Determine effects of multi-temperature distribution on relationship between line ratio and isothermal approx. • Use line emission to constrain DEM models • Imaging Spectroscopy • Obtain and analyze spectra for spatially-separated sources (e.g. footpoints and looptop) • Isolate presumed thermal and non-thermal sources to determine individual thermal/non-thermal properties • Place limits on the extent of non-thermal excitation of the lines
Basic flare model (cartoon and data) (Aschwanden & Benz 1997)